The Growth Plan for the Greater Golden Horseshoe (the "Growth Plan") was approved by Order in Council 1221/2006 and took effect on June 16, 2006. Essentially, the Growth Plan was a response to the environmental impacts of the car-oriented, low density development patterns that had evolved since the 1950's. The Growth Plan is a framework for implementing the Government of Ontario's vision for building cleaner, greener and more prosperous communities through better growth management practices in this region to the year 2031. The Growth Plan is meant to coordinate decision making on the inter-connecting issues of transportation, infrastructure, land use planning, urban form, housing, natural heritage and resource protection.
A key driver of the Growth Plan's policies are its underlying population and employment forecasts. These forecasts are meant to ensure a timely and coordinated approach to land use planning and in theory, to the orderly delivery of infrastructure servicing across the region thereby facilitating the development of complete and liveable communities.
The Greater Golden Horseshoe is one of the fastest growing regions in North America. Immigration continues to be the most important component driving population growth in the region. The Greater Golden Horseshoe is experiencing higher fertility rates and longer life expectancy than previously anticipated when the 2006 Growth Plan forecasts were released.
The first version of the Growth Plan in 2006 was based in large part on the 2001 Census. Since that time, there have been two additional censuses which covered a period of continued economic growth and demographic change. For these various reasons, the Minister of Infrastructure (the "Minister") considered it necessary to re-examine and update the Growth Plan's population and employment forecasts.
This review was undertaken pursuant to subsection 10(2) of the Places to Grow Act, 2005. Throughout 2010-2012, the Minister consulted interested parties and municipalities on revised population and employment forecasts. The updated forecasts were completed by Hemson Consulting ("Hemson"), who was the same consultant that created the original growth forecasts underpinning the 2006 Growth Plan.
The key assumptions underpinning Hemson's 2012 forecasts are:
- That immigration will continue to drive population and economic growth in the region;
- That long-term economic growth will remain positive (an average GDP growth rate of 2.6% is used);
- That manufacturing will remain a key driver of the economy but is expected to continue to decline;
- That fertility rates will increase;
- That life expectancy will continue to extend;
- That household growth will be slower than previously projected.
On May 29, 2013, Amendment 2 (2013) to the Growth Plan was recommended by the Minister and approved pursuant to Order in Council 767/2013. Amendment 2 updates and extends the Growth Plan's population and employment forecasts by 10 years, from 2031 to 2041.
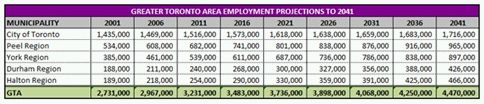
The following is a summary of Hemson's demographic forecasts for the Greater Toronto Area ( the "GTA") which now underpin the Growth Plan. The GTA comprises the core region of the Greater Golden Horseshoe.
Revised Population Projections

Source: MetropolisIQ.com
- A GTA population forecast of 8.33 million residents and 4.07 million jobs by 2031. This constitutes approximately 380,000 more residents and 50,000 more jobs than were projected in the 2006 Growth Plan.

Source: MetropolisIQ.com
- A GTA population forecast of approximately 9,365,000 residents by 2041, an increase of approximately 50% or 3,070,000 residents from 2011. The City of Toronto will remain the largest municipality with 3.4 million residents.
GTA POPULATION GROWTH BY REGION

Source: MetropolisIQ.com
- Year-over-year growth over the next 30 years will average approximately 100,000 residents. York Region will grow by approximately 716,000 residents (+66.8%), the City of Toronto by approximately 675,000 residents (+24.8), the Region of Peel by 618,000 residents (+45.8), the Region of Durham by 559,000 residents (+88.6) and Halton Region by 484,000 (+93.1).
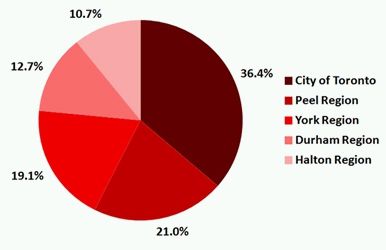
GTA POPULATION SHARE BY REGION – 2011

Source: MetropolisIQ.com
GTA POPULATION SHARE BY REGION – 2041
Source: MetropolisIQ.com
- The strongest population growth will occur in the inner ring of "suburban 905". 78% of all future growth is expected to occur in the Regions of Peel, York, Durham and Halton.
- The remaining 22% of forecasted growth will occur in the City of Toronto. This distribution will translate into Toronto's share of the total GTA population declining, from 43.3% in 2011, to 36.3% in 2041.
- Strong population growth is not only projected to occur in the GTA, but also in the surrounding areas of the Greater Golden Horseshoe which includes the GTA as well as the City of Hamilton, the Kitchener Waterloo Niagara area, and extending north and easterly to include the Cities of Barrie and Peterborough.
- A total population of nearly 13.5 million residents is forecasted in the Greater Golden Horseshoe by 2041, which represents an increase over 2011 levels of close to 50%, or 4.5 million people.
REVISED EMPLOYMENT PROJECTIONS
Source: MetropolisIQ.com
- Strong employment growth is also forecasted over the next 30 years. The GTA will capture approximately 1.2 million new jobs by 2041, an increase of approximately 28% over the 2011 period.
- York Region will experience the strongest employment growth, adding approximately 358,000 jobs (+39.9%), followed by Peel Region at 283,000 jobs (+29.3), Halton Region at 212,000 jobs (+45.4), the City of Toronto at 200,000 jobs (+11.7) and Durham Region at 186,000 jobs (+43.7).
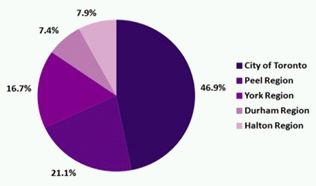
GTA EMPLOYMENT SHARE BY REGION – 2011
Source: MetropolisIQ.com
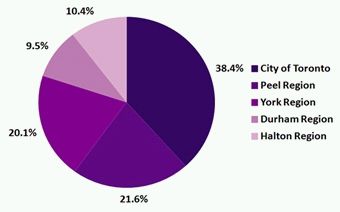
GTA EMPLOYMENT SHARE BY REGION – 2041
Source: MetropolisIQ.com
- 84% of future employment growth to 2041 will occur within the inner ring of the GTA. Peel Region's employment levels are forecasted to increase from 21.1% in 2011 to 21.6% in 2041, York Region's levels will increase from 16.7% to 20.1%, Halton Region's levels will increase from 7.9% in 2011 to 10.4% in 2041 and Durham Region's levels will increase from 7.4% in 2011 to 9.6% in 2041.
- With only 16% of forecasted employment growth, Toronto's share of total GTA employment is projected to decrease from 46.9% in 2011 to 38.3% in 2041.
REVISED HOUSEHOLD PROJECTIONS
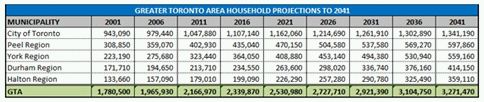
Source: MetropolisIQ.com
- Hemson analyzed household formation and the number of household units required to accommodate the nearly 9.4 million people expected to be living in the GTA by 2041. Based on average projected household size, approximately 3.3 million dwelling units will be required to accommodate population growth to 2041 This represents an increase of approximately 34% over the number of existing residential units in 2011.
- The City of Toronto is expected to be home to approximately 1.3 million dwelling units followed by Peel Region at nearly 600,000, York Region at 560,000, Durham Region at 415,000 and Halton Region at 361,000.
- The City of Toronto is projected to see the biggest growth in the number of households, adding 293,310 dwelling units (+21.9%) by 2041 followed by York Region at 235,720 units (+42.2), Durham Region at 200,440 units (+48.4), Peel Region at 194,930 units (+32.6) and Halton Region at 180,100 units (+50.2).
GTAH HOUSING MIX – 2011
Source: MetropolisIQ.com
GTAH HOUSING MIX – 2041

Source: MetropolisIQ.com
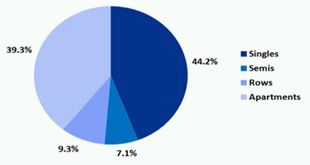
- The Growth Plan's intensification policies will continue to push the increase in density of real estate development. The number of households living in medium and high density units will continue to rise faster than the number of households living in low density units.
- The share of households living in apartments is expected to rise to 40.6% by 2041, and the share of households living in townhouses is expected to rise to 11.6%.
- As the proportion of medium and high density units increase, the share of households living in single detached units is projected to decrease to 41.2%. The share of households living in semi-detached units is forecasted to fall to 6.7%.
Analysis
Section 1.1.2 of the Provincial Policy Statement requires that sufficient land be made available through intensification and redevelopment to accommodate an appropriate range and mix of employment opportunities, housing and other land uses to meet projected needs for a time horizon of up to 20 years, or alternatively, for a greater time period if that time period has been established pursuant to a provincially initiated planning exercise.
The extension of the Growth Plan's planning horizon beyond 20 years, coupled with the magnitude of growth that is forecast within the revised period (which includes a projected exceedance of the 2031 growth targets), provides a strong indication that urban development could encroach further and faster than previously forecasted into the lands commonly referred to as the whitebelt lands (the "Whitebelt"). Stronger anticipated growth will invariably hasten the pace of conflict over the use of the Whitebelt between advocates of greenland preservation and development interests in the region.
Briefly, the provincial Greenbelt Plan (the "Greenbelt") and the Growth Plan work in tandem. The southerly edge of the Greenbelt is buffered by the Whitebelt, which is a long-term strategic land reserve located between the current northerly limits of the urban settlement boundaries, and the Greenbelt.
According to figures released earlier this year by the Building Industry and Land Development Association (BILD), there are approximately 58,700 hectares of Whitebelt land available beyond municipal boundary expansions already approved by the Province. The ongoing municipal official plan updates to bring the GTA's municipal plans into conformity with the Growth Plan include requests to the province for an additional 10,115 hectares of Whitebelt to accommodate development up to 2031 (5,196 ha residential / 4,919 ha employment). These requests represent about 17% of the Whitebelt, leaving approximately 83% of it intact until at least 2031.
Following on the heels of Amendment #2, BILD has asked the Minister to consider a follow-up amendment to the Growth Plan reaffirming that new lands into the urban envelope is a certainty and that protection of the Whitebelt for urbanization is paramount. BILD is also pressuring the Minister to deny further municipal requests to expand the greenbelt, and to take all necessary steps to stop upper tier Official Plans from including policies that currently allow municipalities to sterilize the Whitebelt by permitting "foodbelt", "protected countryside" or similar land use designations.
The development industry is also concerned that extensive lands in the Whitebelt could be permanently frozen. This could occur if prime agricultural lands and environmentally sensitive areas located in the Whitebelt, which are currently afforded little policy protection, are brought under Greenbelt protection by way of an expansion of the boundaries of the Greenbelt or other forms of development restrictions that may be introduced pursuant to amendments to the Provincial Policy Statement. Notably, the Greenbelt Plan is approaching its tenth anniversary, and later next year will be the subject of its first statutory review. Debate over the ecological sensitivity, and the extent of policy protection of the Whitebelt, will surely form a major part of this ten-year review.
Urban sprawl is in nobody's interest and it therefore makes sense to take all reasonable measures to avoid premature urbanization of the Whitebelt. The province and municipalities will need to consider new and stronger policy measures through the Provincial Policy Statement that address the persisting barriers to intensification and higher-density greenfield development. And planners will also need to revisit the notion of "complete" communities with greater emphasis on tools and mechanisms to achieve progressively higher levels of affordable housing.
Of growing concern is the potential for "leapfrog" development beyond the Greenbelt. As it has been noted by advocates of Greenfield preservation, point towers in a sea of low density single family homes may appear consistent with the quantitative goals of the Growth Plan, but ultimately undermine the Plan's primary policy imperative of sustainable development if residents seek more liveable environments on the other side of the Greenbelt. Again, affordable housing is key. The extent of leapfrog development will depend on the success of the "inner ring" municipalities (Hamilton, Toronto and the upper tier municipalities of Durham, Halton, Peel and York) in diversifying their housing markets. Greater affordable housing choice would assist in reducing the pressure for building bedroom communities, and in curtailing the expansion of highways and commuter transit corridors that already cross the Greenbelt serving the "outer ring" (the cities of Barrie, Brantford, Guelph, Kawartha Lakes, Orillia and Peterborough; the Counties of Brant, Dufferin, Haldimand, Northumberland, Peterborough, Simcoe and Wellington; and the Regions of Niagara and Waterloo).
Summary
With anticipated future growth in the GTA being considerably stronger than previously forecasted, and the Growth Plan now directing GTA municipalities to plan beyond the traditional 20 year time horizon, Amendment #2 signals a greateran urgency in the need for advancing a more comprehensive policy framework for the Whitebelt. Developing thatthis framework should be a highly charged topic of debate in the upcoming 10-ten year review of the Greenbelt Plan which upper tier municipalities across the GTA are now beginning to prepare for.
The content of this article is intended to provide a general guide to the subject matter. Specialist advice should be sought about your specific circumstances.

