
. . . even for the same timekeeper, billable hours are not all created equally and do not contribute equally to profits. . . . Stated differently, the hypothetical law firm achieved 90% realization of its targeted annual profit, not by raising hourly rates, but by discounting 25% of its billed hours production. How?
Introduction
The ongoing COVID 19 pandemic has imposed unusual strains on the legal industry over the past year, compelling law firm managers to rethink the structures and timekeeper compositions of their firms. Many responded by reducing firm headcounts and implementing various cost controlling actions such as reducing leased office space. See, e.g., Dylan Jackson, Firms Will Continue to 'Clean House' Next Year, Lawyers Included , Law.com (December 3, 2020).
Those cost-containing measures were rewarded at several firms with dramatic per-partner profitability increases in the lofty ranges of 15% to 25.6 % at the end of 2020. See Dan Roe, At More than a Dozen Firms, 2020 Layoffs Were Followed by Partner Profit Windfalls , Law.com (March 4, 2021). Although increased profitability is always welcome news, it appears that many of these same firms reported mostly flat or slightly elevated annual revenues. Id. As shown in the following analysis, increased profitability in the face of cost-cutting measures does not necessarily translate into future increased profitability.
Year-over-year increases in profitability require not only sustained efficiencies in firm overhead, but also year-over-year increases in revenue and an optimal mix of firm timekeepers. The following analysis employs hourly cost rate and hourly profit rate accounting in the context of a hypothetical law firm to illustrate the origin of profit generation within law firms generally and to challenge the orthodoxies of billing rate realization, partner-to-associate leverage, hourly billing rate escalation, and other industry maxims typically espoused to urge on law firm profit maximization.
Analysis
The practice of law has changed dramatically over the past several decades—changes propelled by technological revolutions in the ways that lawyers work, manage cases, and communicate with clients and each other. These technologies spawned the creation of "global" firms with thousands of lawyers, and in contrast, enabled lawyers to profitably and productively work in smaller and even solo practices. (For a more thorough discussion of the impact of technology on the business of law, see York Faulkner, The Escalating Role of Information Technology & Artificial Intelligence in the Practice of Law , YMF Law Tokyo (2021).)
Despite these rapid changes, the billable hour remains the primary unit for billing clients and measuring law firm performance. Most law firms distribute periodic reports to their partnerships that provide multiple metrics based on billable and billed hours production, e.g., average billed hours per attorney and per various groups within the firm, average billed hours over time, billable hour "realization" rates, etc. Few firms, however, combine the billable hour metrics with their cost accounting and, as a result, operate somewhat blindly in understanding the interaction between expenses and billed hour production. Hourly cost rate and profit rate accounting sheds considerable light on how and why some firms are profitable and others are not, optimization of attorney head counts and billing rates, and the calibration of many other law firm management metrics.
This article discusses hourly cost rate and hourly profit rate accounting in the context of a hypothetical law firm. The assumptions of this hypothetical are intentionally simplified in order to demonstrate the key concepts related to hourly cost rate and profit rate accounting. (For a more formal and alternative discussion of law firm cost and profitability accounting, see James D. Cotterman, Calculating Profitability , Altman Weil, Inc. (2019).)
Here, an annual accounting period is used for ease of conceptualizing the hourly cost and profit rate accounting principles. These principles apply equally to any accounting period, e.g., daily, weekly, monthly, quarterly, etc.
The hourly cost rate and profit rate metrics provide unique perspectives into how law firm profits (or losses) are generated—not only on a firm wide basis, but also by individual attorneys and groups of attorneys, e.g., partners and associates. These broadened perspectives enable greater insights into the optimization of headcounts, hourly billing rates, partner-to-associate "leverage," and other aspects of law firm management. Hourly cost rate and profit rate accounting further enables the analysis of various "what if?" scenarios while altering such variables as headcount, hourly billing rates, etc. The examples in this article show how the hypothetical law firm dramatically increases profits, not by raising hourly billing rates but by discounting rates.
Assumptions
The hypothetical law firm analyzed here has two classes of attorneys—partners and associates.
The partners are pure "equity" partners who are compensated solely from law firm profits. As will be seen, this assumption is a key factor in several of the conclusions that follow. This assumption does not preclude the possibility that the partners in this hypothetical law firm receive monthly or some other periodic fixed "draws" as part of their compensation. However, the accounting and analysis in this article does not attribute partner draws to each partner's share of overhead expense. This treatment of partner draws reflects the legal and economic reality that partners ultimately are paid only after obligations to third parties, hourly wage earners, and salaried employees have been satisfied. In reality, partner "draws" are what the name implies—a draw from the partner's paid-in capital account that must be covered or paid back by a subtraction from the partner's share of firm profits. Nonetheless, the purpose of this article is not to suggest rigorous accounting methodology, but instead to demonstrate the real economic consequences that flow from law firm management strategies and individual attorney decision making.
As shown in the table below, there are 50 partners in this firm who, as a group, have an average hourly billing rate of $900 per hour. At the conclusion of the calendar year, the 50 partners had each billed an average of 1,500 hours totaling 75,000 hours and generating $67,500,000 in revenue.
There are 120 associates in the firm who, as a group, have an average hourly billing rate of $500 per hour. At the conclusion of the calendar year, the 120 associates had each billed an average of 1,500 hours totaling 180,000 hours and generating $90,000,000 in revenue.
Overall, the firm's 170 lawyers billed 255,000 hours and generated $157,500,000 in revenue.
Year-End Results
Following is a representation of the typical year-end, profit/loss law firm accounting:

Based on the operating expense data assumed in the table, the firm generated annual profits equaling $77,500,000. The following table further breaks down profits by attorney group.
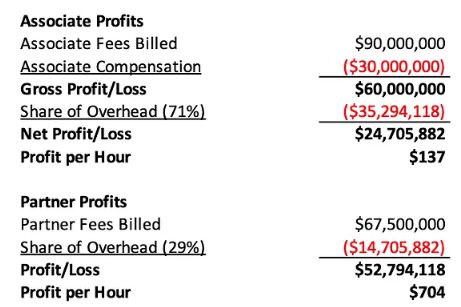
Firm overhead is allocated on a simple per capita basis. After subtracting associate compensation and their share of firm overhead from the associates' revenue, the statement shows that associates contributed $24,705,882 of profit to the firm. On an hourly basis, the associates produced an average of $137 of profit per hour.
Partner profit contribution is computed by subtracting the partners' share of firm overhead from their revenue—resulting in $52,794,118 of profit to the firm. On an hourly basis, the partners produced an average of $704 of profit per hour.
As a first observation, the partners of this firm contribute significantly more to firm profits than associates—both in gross terms and on an hourly basis. The reason for that disparity is due, in part, to the partners' greater hourly billing rates. However, the difference in hourly billing rates is only one factor for that disparity. In fact, as shown by the hourly cost rate accounting discussed below, the difference in hourly billing rates is the least significant factor in explaining disparities between partner and associate profitability.
Hourly Cost Rates & Hourly Profit Rates
As shown below, the first step in computing hourly cost rates is determining (1) firm overhead expense per attorney and (2) salary expense per attorney. Firm overhead is borne by all 170 firm attorneys, both partners and associates. When firm overhead is divided by 170 attorneys, the per-attorney overhead expense equals $294,118. Non-staff salary expense, however, arises only in connection with the employment of associates. When associate salary expense is divided by the 120 associates, the average per-associate salary expense is $250,000. These computations are used to determine "average attorney cost" on an annual basis for partners and associates.

As shown above, the average attorney cost for partners is $294,118—their per capita share of firm overhead. The average attorney cost for associates is $544,118—their per capita share of firm overhead plus their individual salaries.
Immediately apparent from this computation is that partners and associates have vastly different cost structures. That cost structure difference is reflected in the "average hourly cost rate" computations. Here, although both partners and associates each billed an average of 1,500 hours, the hourly cost rates for each group are quite different. The hourly cost rate for partners ($294,118÷1,500) equals $196 of cost per hour.
In contrast, the hourly cost rate for associates ($544,118÷1,500) equals $363 of cost per hour. This divergence in hourly cost rates has nothing to do with differences between the partners' and associates' respective billing rates. Rather, due to the salary expense incurred in hiring associates (relative to partners) each associate has a much steeper and taller hill to climb along the way to generating profits for the firm.
Compounding the associates' difficulty in generating profit is their typically lower hourly billing rates relative to partners. The "average hourly profit rate" shown in the table above demonstrates the disparities in profitability between partners and associates. Here, the hourly cost rate computations are confirmed by the traditional accounting methodology, showing that on average, partners generated $704 of profit per hour and associates generated only $137 of profit per hour.
The hourly cost rate and profit rate accounting metrics provide an alternative method for presenting the law firm's Annual Profit/Loss Statement.

Here, the hourly billing rate, cost rate, and profit rate figures for partners and associates are used together with average per attorney hours to compute revenues and profits for each group of attorneys and total firm profit. The partners generated $67,500,000 of revenue (75,000 hours x $900 average hourly billing rate), resulting in $52,794,118 of profit (75,000 hours x $704 average hourly profit rate) (decimal values of the $704 per hour profit rate are not shown). By comparison, the associates produced $90,000,000 of revenue (180,000 hours x $500 average hourly billing rate), resulting in $24,705,882 of profit (180,000 hours x $137 average hourly profit rate) (decimal values of the $137 per hour profit rate are not shown). Combining the profits of both groups results in a total of $77,500,000 profit for the firm.
This presentation of the firm's Annual Profit/Loss Statement enables year-to-year comparison of the cost structures and profitability on an hourly basis as well as an assessment of the profit contribution of attorney groups (and individual attorneys).
A point deserving emphasis here is that although the hourly billing rates for partners and associates are static, i.e., they apply equally to each hour billed, hourly cost rates are not fixed. Instead, hourly cost rates are dynamic and change with each hour billed.
In the computation above, the $196 hourly cost rate for partners, for example, is a function of the number of hours billed by the partners. Because "hours billed" is in the denominator of the equation, as the number of hours billed increases, the hourly cost rate decreases. That inverse relationship between hours billed and hourly cost rates is illustrated in the following table:

The table shows that the hourly cost rate applicable to the first hour billed by a partner in the firm is $294,118 and for associates, the hourly cost rate of the first hour billed is $544,118. However, by the time that partners bill their 1500th hour, the hourly cost rate has fallen to $196. Associates achieve an average hourly cost rate of $363 upon billing their 1500th hour.
The "hourly cost rate" alternatively can be thought of as a "break even hourly billing rate"—the hourly rate at which for a specific number of hours billed, the timekeeper breaks even or just covers his or her share of annual attorney cost.
The following table combines hourly billing rates with hourly cost rates over the course of 2000 hours of billings for both partners and associates—demonstrating the impact of declining cost rates on timekeeper profitability.
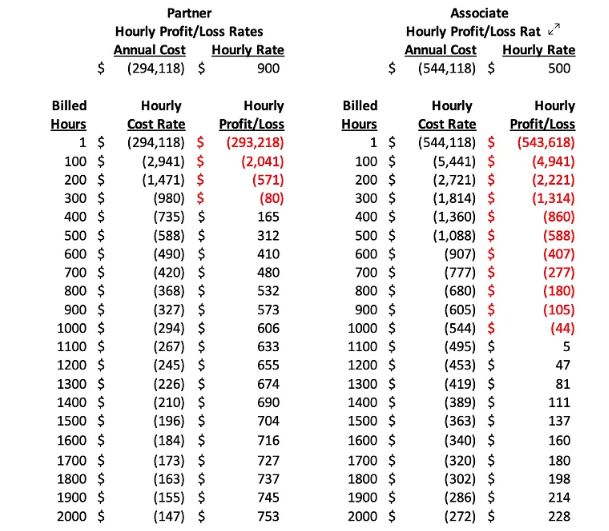
Here, for example, the first hour billed by a partner generates a loss of $293,218. However, as shown in the table, the partners' billings begin generating profits at some point after 300 billed hours.
In contrast, associates in the firm do not begin generating profits until after they have billed 1,000 hours. Again, this disparity results from both differences between partner and associate hourly billing rates AND hourly cost rates.
Because partners have smaller hour-by-hour hourly cost rates, partners will, at any given hourly billing rate, generate more profit (or less loss) than an associate at the same number of hours billed.
The following table illustrates this point:
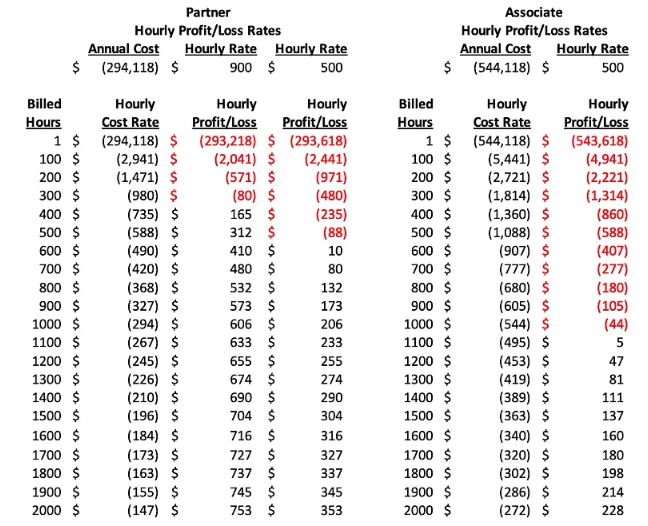
This table adds a column to the partners' hourly profit/loss computations, demonstrating the profit/loss that partners would generate if they billed their hours at $500 per hour, i.e., associate billing rates.
The table shows that even at $500 per hour, partners would become profitable at some point after billing just 500 hours and at 2000 hours would generate profits of $353 per hour—compared to just $228 per hour for associates at the same hourly billing rate.
To view the full article please here.
The content of this article is intended to provide a general guide to the subject matter. Specialist advice should be sought about your specific circumstances.

