
Wholesale power pools present a number of complex challenges for regulators. Foremost amongst these challenges is the need to identify both the existence and use of market power. To this end, this paper considers the merits of several different approaches to analysing market power in a power pool.
An international survey of power market regulators in 2004 found the identification and mitigation of the effects of market power to be the highest priority in their development of economic models1. High concentration of ownership in electricity generation, and the potential for that concentration to increase further through mergers, suggests that this issue will remain a prominent one in the industry for some years to come.
Market definition
The first step in assessing a firm’s market power is always to identify the market(s) in which the firm is operating. In the wholesale power industry, we are primarily concerned with identifying the geographic and temporal boundaries of a market. This is not straightforward. The limited capacity of the transmission lines that connect adjacent regions, mean that the degree to which a firm in one region acts as a competitive constraint on a firm in an adjacent region may depend on the total level of demand at the time. Thus, depending on the prevailing conditions, it may be appropriate to define a market as the Victorian wholesale electricity market during peak demand periods, or the entire NEM during periods of low demand.
Fortunately, the methods for determining market power are relatively insensitive to the geographic or temporal scope. Therefore we separate the two issues, relegating the discussion of market definition to another time, and focus instead on the idiosyncrasies of market power in power pools.
What is market power?
Market power is defined by economists as ‘the ability to alter profitably prices away from competitive levels’2 .
Therefore, it is the ability to either increase prices above the competitive level, or decrease prices below the competitive level. Regulators tend to take a different approach. In the antitrust literature, market power has been loosely defined as the ‘ability to give less and charge more’3 . In the ACCC merger guidelines, the definition of market power is extended to ‘the ability of a firm or firms profitably to divert prices, quality, variety, service or innovation from their competitive levels for a significant period of time’.
It is important to remember that market power refers only to the ability to do something. Therefore, assessing market power alone will not allow you to predict outcomes. We must also take into account a firm’s incentive to exercise any market power that it possesses.4
Understanding a wholesale power pool
A wholesale power pool is an intermediate market. As such, it is a market in which firms trade with firms; a situation that is further complicated by the fact that a single firm may operate as both a buyer and seller. The importance of achieving competitive outcomes in intermediate markets is well known to economists. Of particular concern is the double-marginalisation problem, in which social welfare losses are compounded by sellers exercising market power in both the intermediate and end product markets.
There are three main groups of players in the power generation industry: Generators own the infrastructure that produces the power, retailers purchase the power from generators and resell it to their customers, the end users.5
End users do not directly participate in the wholesale power pool. The usage decisions of end users is generally not dependent on the prevailing price of the wholesale electricity market. For this reason end users are not thought of as active participants in a power pool.
Retailers must meet the demand of end users the instant that it occurs. Retailers have no capacity to store electricity, and as a consequence a retailer must purchase sufficient electricity to cover the entire demand of its customers. Effectively, retailers have no ability to control their own demand. Moreover, the demand of retailers is not price sensitive as end users are not exposed to price fluctuations in the NEM.
A wholesale power pool is a highly structured market. Power pools are regulated by a system operator, in Australia the National Electricity Market Marketing Company (NEMMCO). NEMMCO administers the auctions that determine both which generators will be dispatched at any time, and the regional spot price that all generators in that region will receive for their output.
The auction has the following structure, which is similar to the structure employed by other power pools around the world:
- Each day every generator independently submits bids for the following day’s trading. For each half hour trading interval the generator must nominate 10 price bands, and for each five minutes in the half hour, the quantity of power that the generator is willing to supply at each of the 10 price bands. Quantities can be altered at any time up to five minutes prior to the dispatch time.
- In each five minute interval each electricity retailer demands a quantity of power equal to the total demand of its customers. This demand tends to be insensitive to the price.
- NEMMCO then instructs generators to dispatch units of energy into the power system, starting with the units that have been bid in at the lowest price, until the combined demand of the retailers has been satisfied using the lowest priced bids.
- The dispatch price for the five minute period is the price at which the last unit of power to be dispatched was bid into the market. The spot price – paid by retailers and received by generators – is the average dispatch price in each half hour block.
The bids and price bands together create a generator’s supply curve. Figure 1 presents the supply curves of a base load generator, and a peaking generator. The operation of a base load generator is characterized by a low marginal cost, however base load generators are very expensive to start and stop, thus the generator benefits from constant operation. Peaking generators have a high marginal cost, but can be activated quickly to deal with peak load requirements.
Figure 1: Two supply curves

One final aspect of the NEM is worth noting. In order to protect against price volatility both retailers and generators enter into hedge contracts. Hedge contracts are financial instruments that help to insure firms against unexpected price fluctuations; they are not traded in the NEM but rather they are a financial contract between two parties similar to hedge contracts for interest rates or commodities. A generator’s position in the hedge market critically impacts upon its incentive to exercise any market power that it may possess. We return to this topic below.
Methods for measuring market power
In this paper we consider five common methods for measuring market power. In each case we will highlight the way in which the unique characteristics of a wholesale power pool complicate the analysis.
- Profits
- Withholding supply
- Lerner Index
- Market concentration
- Equilibrium analysis using simulation
1. Profits
Market power implies the ability to profitably increase the price away from the competitive level. All else being equal, a firm’s profit should be an increasing function of the extent to which it is exercising its market power. It follows that a firm’s profits can be used both as a measure of the firm’s market power, and the firm’s incentive to exploit that market power.
The basic steps in measuring profitability in relation to market power are as follows:
- Measure of profitability : Measure the profit from providing the product(s)/service(s) in the relevant market.
- Benchmarking : Determine the competitive benchmark against which the firm’s profit should be compared.
- Interpretation: If there is a gap between the measure of profitability and the benchmark, determine the extent to which the gap is caused by market power.
Profitability can be a problematic concept to apply.6 To begin with, it is debatable which measure of profitability is most relevant.7 The Internal Rate of Return (IRR) and Net Present Value (NPV) are likely to be reasonable measures.8 Regardless of the measure that is used, extracting profit from accounting data can be quite complex. Different firms present their accounting data in different ways, and there may be some debate as to how costs should be attributed to the various activities of the firm.
Selecting a benchmark can likewise be problematic. Benchmark profits should reflect competitive outcomes, and competitive outcomes arise from competitive behaviours. Given a good understanding of competitive behaviour, a sufficiently detailed economic model should generate a reasonable benchmark. However, as with any modelling exercise, the product of a model is only as good as the information from which the model is constructed. Once again, uncertainty over the correct measures of costs, and uncertainty concerning what constitutes competitive behaviour complicate the analysis.
For example, a zero economic profit benchmark may be inappropriate when analysing short term profits. In markets with durable assets and high fixed costs, such as power generation, there are likely to be sustained periods of high and low (even negative) profits, regardless of the competitiveness of the market.9 Moreover, a generator may benefit from being more efficient than its rivals, or from capacity constraints in the power pool. While examining profits over a longer time horizon will suppress these distortions, it may not be appropriate as a given generator may only have a small window in which it is able to exercise its market power.
Another simple, though not necessarily practical, approach would be to use the profits of a similar firm. Given that similar firms, operating in the same market, have the same opportunities and incentives to exercise market power, the benchmark firm should come from a different market; a market that is operating competitively. The difficulty with this approach is that it relies on being able to determine when the power pool in which the benchmark firm is operating, is competitive.
The final stage in the analysis is to determine the extent to which any profits in excess of the benchmark result from the firm exercising market power. This is not a straightforward process. As all trades in the power pool take place at a common spot price, it only takes one generator exercising its market power to increase the profits of all generators in the market above their respective competitive benchmarks. Determining which firms are responsible for any given supra-competitive prices will require a detailed analysis of their bidding behaviour.
2. Withholding supply
In a standard market, market power often manifests itself as the ability of a firm to withhold supply, such that there is a reduction in the market supply. The effect of a reduction in the market supply can be seen in the top panel of Figure 2. As the market supply is reduced from s1 to s2, excess demand forces the market price to increase above competitive levels from p1 to p2 and the total quantity traded in the market is reduced from q1 to q2. If a firm has the ability to withhold supply such that it is profitable for a firm to do so, the firm has market power.
For example, observing that a generator does not choose to supply a MW of electricity, when the marginal cost of the MW is less than the price, suggests that the generator is attempting to increase price by withholding supply. Assuming that the behaviour of the generator is rational, the generator must expect to profit from this act, and as such the withholding of supply is evidence of market power.
Figure 2: Efficient behaviour
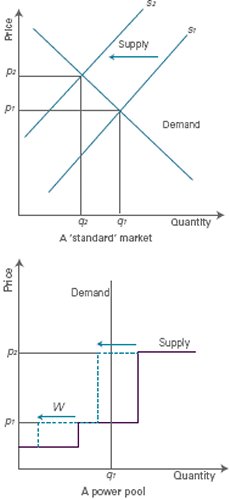
The bottom panel of figure 2 illustrates the way in which a generator that supplies a sufficient quantity of electricity at the spot price can raise the pool price by withholding supply. A generator that withholds the amount W shifts the industry supply curve to the left (the dashed line). Demand is insensitive to price as it is determined by the behaviour of end users, thus the market price increases from p1 to p2, while the quantity supplied does not change.
Determining the extent to which a firm is withholding supply can be difficult in many industries. However, in electricity generation, it is at least possible to use bid data, as well as information on production costs, to determine whether market power has been used at any point in time. The UK regulator has endorsed this approach, saying that it ‘will seek, wherever possible, to assess both substitution possibilities and actual behaviour directly, rather than rely on proxies such as market share’10 [emphasis added]. For example, a generator that routinely raises its bids during periods of peak demand would be viewed as exercising market power.
3. Lerner Index
While checking for withheld supply is sufficient to establish that a generator is exercising market power, it does not indicate the degree of the generator’s market power, neither can it reveal the existence of latent market power. These questions require a more sophisticated analysis, and the method that is most commonly used is the Lerner Index. The Lerner Index is derived from the profit maximising condition. In a standard industry, the profit maximising condition for a firm with a constant marginal cost of c is,
![]()
The term on the left hand side of equation (1) is the mark up on the firm’s product, as a proportion of price. The term on the right hand side is known as the Lerner Index. The Lerner Index can be interpreted as the percentage by which the price will increase if the firm reduces its supply by 1%. As such it is a direct measure of a firm’s ability to distort prices in a market by withholding supply.
The Lerner Index is a convenient measure of market power in a power pool as it can be calculated from the price elasticity of the firm’s residual demand curve. In turn, the residual demand curve can be readily constructed from NEM bid data. Put simply, for a given price a generator’s residual demand is the amount of demand that is ‘left over’ once the bids of all other generators have been taken into account.
Figure 3: Residual demand
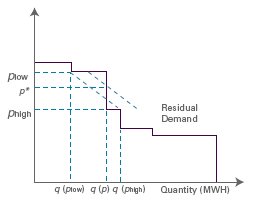
Figure 3 illustrates a typical residual demand curve. Notice that it steps down to the right (the opposite of a generator’s supply curve).11
Before calculating the Lerner Index the residual demand curve needs to be ‘smoothed’ whilst preserving the trends in the curve, and suppressing the distortions created by local kinks. Wolak12 suggests a technique that will:
- produce a conservative estimate of the Lerner Index, erring on the low side;
- be robust in so far as similar methods of measuring will produce similar results; and
- be sensitive to local variations in the trend, rather than averaged over large sections of the residual demand curve.
Examining figure 3 we can see that a typical residual demand curve is relatively flat at either end and steeper in the middle. In this example we are interested in the slope at the spot price p*. A conservative estimate of slope is the slope of dashed line connecting q(plow) to q(phigh). This is the flattest slope in the neighbourhood of p*. Because we are interested in the Lerner Index at p*, this slope is translated to pass through the residual demand curve at p*. Formally, Wolak’s estimate of the Lerner Index is given by,

Wolak’s estimate of the Lerner Index is a measure of market power. A high value of the Lerner Index indicates that, by withholding supply, a generator can engineer a proportionately large price rise. Unlike the profit and withholding methods described above, the Lerner Index is a measure of a generator’s latent market power.
Hedge contracts
Prima facie, the purpose of hedge contracts is to ensure the participant in a power pool against unexpected fluctuations in spot prices. In a power pool, hedge contracts have the additional effect of reducing the incentive for generators to exercise market power.
Stated simply, a generator holding a hedge contract is effectively receiving a fixed price for that portion of output covered by the hedge. For this reason, a generator’s incentive to exercise market power is reduced proportionately.
Why would a generator put itself in a position where it did not want to use its market power? Certainly, a monopoly would never wish to take any action that reduced its incentive to use market power, and thus reduced its profits. But power generation is an oligopoly industry. An oligopolist must balance the competing goals of pushing up prices and competing for market share. As a hedge contract is essentially a commitment to produce electricity at a given time, it serves the second of these two goals.13
4. Market concentration
Measures of concentration are routinely employed by competition authorities as a means of estimating the market power of market participants.14 The use of concentration measures follows from the Cournot model of competition. In the Cournot model firms are engaged in quantity competition; setting quantities in advance and then receiving the market clearing price for their efforts.
In the equilibrium of the Cournot model, the price-cost margin of each firm depends upon both the elasticity of market demand and each firm’s market share. Specifically, as concentration – measured either by the Herfindahl-Hirschman Index (HHI) or Concentration Ratio (CR) – increases, so does the price cost margin.
There are a number of similarities between Cournot competition and competition in the NEM. In both cases, firms are competing on the basis of the quantity that they are willing to supply, and in both cases these quantities are set unilaterally and in ignorance of the actions being taken by the firm’s competitors.
Nevertheless, there remain significant differences between Cournot competition and competition in the NEM that render measures of concentration inappropriate as a measure of market power.
Bids submitted to the NEM are contingent on the spot price (recall the stepped supply function). This is fundamentally different to a market in which a generator is committed to a given quantity regardless of the prevailing price. In practice, the stepped bid function renders the residual demand curve more elastic (price sensitive) than is assumed by a Cournot equilibrium. It follows that measures of concentration overestimate market power in a power pool.
Additional difficulties arise insofar as cost structures vary widely between generators. Borenstein et al (1999) show that HHI can increase as market power decreases, because at low levels of demand, and thus low prices, peak load generators shut down leaving base load generators with a higher market share.
Of the four measures of market power discussed thus far the Lerner Index is without a doubt the most consistent, versatile and informative. In terms of the mathematical, the Lerner Index represents the solution to a system of equations when these equations are ‘well behaved’.15 If the system of equations is not well behaved – either because of a complex industry structure, or an unusual business model – another method for assessing market power must be employed.
5. Equilibrium analysis using simulation
One alternative is to create a comprehensive mathematical model of the industry, employing an algorithm to search for a solution to the problem. This technique is known as simulation. While simulation has yet to find its place as a fundamental tool of competition analysis, it is well suited to an industry, such as power generation, in which detailed knowledge of technical constraints and firm behaviour are readily available.
A somewhat simplified description of the process is as follows: Begin by assuming perfect competition in the market and simulate prices and profits. Next, assume profit maximising behaviour and compute prices and profits. Any difference between the two is due to the presence of market power in the industry. A sustained difference between simulated competitive profits, and actual profits, implies generators are using that market power.
As is the case with many economic models, simulation is very sensitive to underlying assumptions. This was illustrated in a recent survey of three models of competition in a wholesale power pool. While the three assumed the same form of competition, and produced identical predictions of competitive behaviour, they differed in their predictions of the industry equilibrium when generators act as profit maximisers.16
Whenever a discipline adopts new techniques, there is a period of experimentation during which a robust system of standards is developed. While such standards are yet to be established for simulation, there appears to be a growing consensus that these models will provide valuable insights into the behaviour induced by different market structures.17 This is not to say that simulation analysis is uncontroversial. Simulations of power pool dynamics have been criticised by some authors for employing assumptions and approximations that could significantly distort the outcomes of the model.18
Price spikes
Consumers of electricity would be surprised to learn that spot prices in the NEM can spike from their normal range of $25-$40 per Mega Watt Hour (MWH), to highs in the thousands of dollars. While there can be no doubt that the prices during these peaks lies far above the marginal cost of any generator operating in the market, it is also true that price spikes are generally short in duration and occur at random.
Figure 4: Price spikes

Wholesale electricity markets are particularly vulnerable to price spikes due to the inability of retailers to store power in significant quantities. Figure 4 shows how small fluctuations in demand can result in large fluctuations in price. The highest prices can only come about as a result of generators exploiting their market power during periods of peak demand.
There has been much debate in both the US and Australia concerning the very high prices that can occur during periods of peak demand. Some see these price spikes as evidence of generators abusing their market power and holding the community to ransom. Others view them as necessary for generators to recoup their fixed costs. Both points of view are flawed.
‘One central insight from both theoretical and empirical models of restructured electricity markets is that a single market can at times exhibit very little market power and, at other times, suffer from the exercise of a great deal of market power.’19
Even in a perfectly competitive market, when production capacity reaches its limit, prices will rise above marginal cost. The resulting economic profits that flow to firms are not inefficient as they do not create a dead weight loss.20 Instead, the economic profits create an incentive for new firms to enter the market, resulting in increased production capacity that in turn pushes prices down.
When generators possess and exploit their market power, price spikes will occur more frequently and be greater in magnitude. Nevertheless, many of the same factors are still at work. High profits still invite entrants. We would expect firms to continue entering so long as the available profits exceed the cost of entry. The operation of a generator is an inherently long-term venture. Unless generators retain pricing freedom, we cannot expect competitive forces to bring about an industry structure that is close to competitive.
As always, regulators must be wary of regulating away profits that occur in an oligopolistic market. The consequences, in terms of discouraging efficient entry and investment in technology, are well known.
Conclusion
Measuring market power in any industry is a not a simple task. Whichever method is chosen, we must always be mindful of the underlying assumptions. An assessment of the profitability of a firm is unlikely to produce definite conclusions because of debates over the appropriate measurement of the actual profits, and over an appropriate benchmark to compare these profits to. Searching for instances of generators withholding supply may give a regulator some general insight into the conduct of generators, but the difficulty of actually determining a marginal cost curve, and the multitude of other factors that influence generators’ bids, make it difficult to prove through this type of analysis that a generator is using its market power. Measures of market concentration are unlikely to be of assistance as a result of the significant differences between electricity power pools and standard oligopolistic industries in which measures of market concentration have been used in the past.
While simulation promises to further inform our understanding of power pool dynamics, the lack, as yet, of a widely accepted standard methodology creates a barrier to its use in competition analysis. Therefore, arguably the Lerner Index provides the most robust and consistent measure of market power in an electricity power pool.
Footnotes
1 See K. Neuhoff, J. Barquin, M. Boots, A. Ehrenmann, B. Hobbs and F. Rijkers, ‘Network-constrained Models of Liberalized Electricity Markets: the Devil is in the Detail’, Cambridge Working Papers in Economics 0405 - CMI Working Paper 32, January 2004 (‘Neuhoff et al paper’)
2 Mas-Collel et al ‘Macroeconomic Theory’ Oxford University Press, New York, 1995, p383.
3 Brunt M, ‘Market Definition Issues in Australian and New Zealand Trade Practices Litigation’ Australian Business Law Review 86 (1990) 18, p107.
4 See, for example, National Competition Council Final Recommendation re: Declaration of Airside Services at Sydney Airport 2004.
5 The owners and operators of the transmission network also play an important role in the industry. However, their role is essentially passive for the purposes of assessing market power in the power pool.
6 OXERA, Assessing profitability in competition policy analysis - Economic Discussion Paper 6, July 2003, p1(‘OXERA paper’).
7 OXERA paper, p1.
8 OXERA paper, p3.
9 Borenstein, S., J. Bushnell and F. Wolak (2000). ‘Diagnosing Market Power in California’s Deregulated Wholesale Electricity Market. POWER Working Paper PWP-064, University of California, August, 2000, p 36 (‘Borenstein paper’).
10 Office of Gas and Electricity Markets, paper on Competition Act 1998 - Application in the Energy Sector, p21.
11 Readers familiar with economics will realise that the structure of this residual demand curve permits only two values of the Lerner Index, zero and infinity. A Lerner Index of zero – corresponding to the horizontal line segments – implies that the generator has no control over the price, while a Lerner Index of infinity implies that any reduction in quantity will raise the price without limit. A cursory examination of figure 3 reveals that neither interpretation is true here.
12 Wolak, F., ‘Measuring Unilateral Market Power in Wholesale Electricity Markets: The California Market, 1998–2000’, American Economic Review 93(2), 2003, pp425-30.
13 This issue is analysed extensively in Gans, J., D. Price & K. Woods, ‘Contracts and Electricity Pool Prices’, Australian Journal of Management 23(1), (1998), pp83-96.
14 See OFT, DoJ and ACCC merger guidelines.
15 Well behaved, in this context, is an entirely mathematical concept. Needless to say, there is no reason to expect any real world system to be well behaved.
16 Neuhoff et al paper.
17 Neuhoff et al paper, p4.
18 Rajesh Rajaraman and Fernando Alvarado, ‘(Dis)proving Market Power,’ Publisher, Location 2002, p2.
19 Borenstein paper.
20 High prices are not preventing socially valuable trades as the firms do not have the capacity to produce additional output.
This publication is intended as a first point of reference and should not be relied on as a substitute for professional advice. Specialist legal advice should always be sought in relation to any particular circumstances and no liability will be accepted for any losses incurred by those relying solely on this publication.

