

This fall Outlook has three sections. The first section sets out our view of the economic outlook commencing with a very short summary of recent world economy dynamics, followed by a review of the outlook for global growth and Canadian growth for 2015 to 2017. The second section contains an analysis of the factors which underpin the evolution of Canada's competitiveness over the last decade and examines the chance of regaining some competitiveness in the next few years. The third section analyzes likely global trade developments and their implications for Canada.
Section I: Global Short-Term Outlook: 2015-2017
Recent World Economy Dynamics
Data releases since the publication of our Spring 2015 Economic Outlook last June reinforce our earlier expectations of a significant loss of momentum in the world economy this year. This loss largely originates from China and commodity-producing countries. The moderate slowdown in China, which has accompanied its ongoing rebalancing away from the industrial sector, has exacerbated excess supply in markets for commodities, including oil, with the resulting fall in prices depressing growth in the commodity-producing countries, both advanced and emerging. In countries like Russia and Brazil, "political" problems have contributed to deep recessions, with adverse spillover effects on trading partners. At the same time, the negative shock to the U.S. economy early in the year turned out to be much less severe than estimated at first, was followed by a sharp rebound of activity in the second quarter, and then by moderate growth in the third quarter, in part reflecting a temporary inventory correction. The economy is on track to expand by about 2.5 percent in 2015, in line with earlier expectations. In the Euro area, the stronger momentum of activity previously envisaged for this year in response to lower oil prices and a weaker currency is materializing and will probably bring annual growth to about 1.5 percent. In Japan the economy fell back into a slump in the second quarter after a surge of activity early in the year on the back of strong business spending; the economy is on track to grow by only around 0.6 percent this year, in line with earlier expectations.
WTI oil prices have continued to be volatile in recent months but on net have fallen from about US$60 per barrel in June to about US$40 in late November, significantly below the range we anticipated for the second half of 2015. As before, current futures prices show a gradual rise over the next several years, but to levels that are considerably lower than expected last June. Presumably the rise reflects expectations of firming demand and supply growing at a slower rate in the oil market.
The U.S. dollar has continued to appreciate against many currencies since last June, but especially against the currencies of commodity-producing countries (including Canada). The multilateral appreciation was in response to generally weakening commodity prices and short-term prospects for comparatively strong growth and rising interest rate differentials in favour of the U.S. This additional appreciation should work toward rebalancing global growth.
Global Growth Outlook: 2015-2017
We expect global growth to fall from 3.4 percent rate in 2013 and 2014 to 3.0 percent in 2015 and to much the same rate in both 2016 and 2017; in brief a "low-for-long" scenario. In this scenario, growth in both the advanced economies and the emerging economies roughly stabilizes going forward instead of firming up as expected before. This more pessimistic view reflects our growing conviction that trend (potential) growth rates have fallen, for reasons that are not yet entirely clear. This has contributed to the systematic and widespread over-prediction of growth in the last several years. In the case of the emerging economies, we foresee a steady, appreciable weakening of growth in China, more pronounced than expected by many. As well, we anticipate a relatively modest pick-up in other emerging economies, keeping their growth rate modest by historical standards, notwithstanding high growth in India. These economies do not bounce back more forcefully after their plummeting growth in 2015 for several reasons: their trend growth rates will be significantly lower than it used to be; commodity prices, which affect many of them, will remain subdued; and political/institutional difficulties in Russia and Brazil will dissipate only slowly, if at all in the immediate horizon.
We project the WTI oil price to remain volatile but to trend up from a late November level of about US$39/bbl to US$45-55 in 2016 and US$55-60 in 2017. This is significantly lower than in the spring for three reasons. First, part of the unanticipated current weakness of oil prices likely reflects more abundant inventories relative to demand than anticipated earlier, probably because of slower adjustment of demand and supply. Second, the price threshold for profitable oil production going forward appears to be lower than previously expected as the scope for cost reductions due to improving technologies may have been underestimated. As a result, a more responsive oil supply should restrain price recovery more than previously expected. Third, going forward, growth in the global economy, and in China in particular, is expected to be lower than previously projected: this would result in slower growth in world oil demand.
Table 1: Short-term Prospects for Output Growth (%)*
| Share (%) | 2014 | 2015 | 2016 | 2017 | |
|---|---|---|---|---|---|
| Canada | 1.5 | 2.4 (2.5) | 1.3 (1.7) | 2.0 (2.5) | 2.3 (2.0) |
| United States | 16.4 | 2.4 (2.4) | 2.5 (2.5) | 2.6 (3.1) | 2.4 (2.6) |
| Euro area | 12.3 | 0.9 (0.9) | 1.5 (1.4) | 1.5 (1.5) | 1.4 (1.5) |
| Japan | 4.6 | -0.1 (-0.1) | 0.6 (0.4) | 0.8 (1.5) | 0.7 (1.3) |
| China | 17 | 7.3 (7.4) | 6.8 (6.7) | 6.0 (6.3) | 5.2 (6.1) |
| Rest of the World | 48.2 | 3.3 | 2.6 | 2.9 | 3.1 |
| World | 100 | 3.4 (3.3) | 3.0 (3.2) | 3.1 (3.5) | 3.0 (3.5) |
*Figures in brackets are from the Bennett Jones Spring 2015 Economic Outlook.
U.S. growth is expected to remain around 2.5 percent in the next two years, underpinned by still accommodative monetary and credit conditions that would support solid household consumption and housing investment. There should also be reduced drag from fiscal policy. Lower energy prices should have a net positive effect on growth in 2016 as the stimulus they provide to consumer spending would dominate the negative effect they have on investment in the oil and gas sector. This is in contrast to what happened early in 2015. Headwinds, however, would come from three sources that would restrain the contribution of net exports to growth: the recent appreciation of the dollar; relatively modest growth in emerging economies; and a gradual rise in U.S. interest rates which risks strengthening the dollar further and causing adverse balance-sheet effects in emerging economies.
Like the financial markets themselves, we think that there is a fairly high probability that the Fed starts raising its policy interest rate at the next FOMC meeting in mid-December, on the strength of recent data regarding the state of the U.S. economy and the U.S. labour market in particular. We would expect the Fed to raise rates somewhat further in 2016 and 2017, but to move very cautiously in doing so.
In the Euro area, the recent stronger momentum in aggregate demand is expected to carry on over the next two years, generating growth in the order of 1.5 percent annually. The stimuli from weaker oil prices, the ECB's continuing unconventional monetary policy, the depreciation of the euro and less drag from fiscal policy are expected to overcome the negative effects of lingering deleveraging in the economy, slowing growth in China, and relatively weak growth in other emerging economies.
In Japan, growth is expected to remain subdued at around 0.7 percent because of stubbornly sluggish consumption in spite of easier unconventional monetary policy and lower oil prices. The impact of the weaker yen on net exports will be blunted by slowing growth in China and relatively weak growth in other emerging economies.
Growth in China should continue to decelerate over the next three years as previous excesses in real estate, credit and investment continue to unwind. An easier monetary policy, lower prices for oil, and expected further progress in implementing structural reforms should stimulate household consumption. This will help buffer aggregate demand while the economy rebalances away from investment and industrial production toward consumption and services. Thus a gradual rather than an abrupt slowing in growth is anticipated, though one that is now expected to be more pronounced than even we thought before. Our impression now is that the trade-off between the objectives of rebalancing and growth for the Chinese authorities has moved slightly in favour of rebalancing, although the authorities will continue to be concerned about the employment implications of such rebalancing, especially for northern China. This being said, the international context currently envisioned would make preserving growth while rebalancing more challenging. Export growth is set to be constrained by lower trend growth in the world economy, the already large Chinese shares of markets for many goods, and the marked renminbi appreciation relative to the yen and the euro.
As always, there are considerable risks to global growth over the short term. There are downside risks as always, but we feel that our marking down of growth rates for both advanced and emerging economies have reduced these risks, namely: a sharper-than-expected deceleration of growth in China, with adverse consequences for commodity prices; a weaker momentum of activity in the U.S.; and adverse geopolitical developments. There are both upside and downside risks related to the future path of oil prices and the responsiveness of demand and supply to lower oil prices.
This projection of global GDP growth suggests that global trade should expand at a relatively modest pace over the next two years. It used to be that international trade grew much faster than global demand. This has not been the case in recent years for cyclical and structural reasons. Whether this lower trade intensity will rebound somewhat in the future remains to be seen, but clearly a faster pace of trade liberalization would help (See Section III below for prospects in this regard). This is not without consequence for the Canadian economy, given its dependence on trade.
Short-Term Outlook for Canada: 2015-2017
We expect growth in Canada to pick up from a much weaker than expected 1.3-percent rate in 2015 to 2.0 percent in 2016 and 2.3 percent in 2017. The expansion going forward will be supported by solid growth in the U.S. and continued very low interest rates providing support to final domestic demand. Most importantly, by mid-2016 we foresee less drag from the retrenchment of investment in the oil and gas sector so that, on an annual basis, business non-residential investment should stabilize in 2016 and resume growth in 2017. While trend growth continues to be constrained by an aging population and weak productivity performance (see Section II), a weaker Canadian dollar and improved cost competitiveness will support a firming of growth. This is notwithstanding an adjustment to excess supply in the housing market, after several years of strong housing investment growth, which will keep the level of residential investment flat in 2016 and reduce it in 2017, making housing a drag on growth going forward.
In our Spring Outlook we concluded that the recently announced government budgets would entail a fiscal drag on growth in Canada from 2015 to 2017. With a new, expansionary budget in Alberta and expectations of an easing in the fiscal stance of the new federal government, the overall fiscal impact on the economy in 2016 and 2017 should be significantly less restrictive than previously expected, if not even expansionary. This contributes to the forecast strengthening of growth in 2016 and, especially, 2017 in this Outlook. By stimulating domestic demand directly and by raising household and business confidence (with some positive effect on private spending), growth should be higher. As we argued in previous reports, fiscal policy influences economic performance and has a role to play in bringing and keeping the economy close to its potential.
The Canadian projection is not without some downside risks, related in particular to a weaker-than-expected response of net exports to recent gains in competitiveness, to more drag on growth than assumed from recent low oil prices, and to more drag on growth from lower oil prices than currently projected. On the other hand, fiscal policy may turn out to make a larger contribution to growth, not only directly through fiscal expansion, but also by raising household and business confidence.
The Canadian dollar has hovered around US$0.75-0.76 in the last three months to late November. In light of the strong correlation between movements in oil prices and the Canadian dollar exchange rate, the outlook for the Canadian dollar importantly hinges on prospects for oil prices. On the assumption that WTI oil prices evolve to a range of US$45-55 in 2016 and US$55-60 in 2017, compared to an average of US$45 in the last three months, we might normally expect the Canadian dollar to move in a range of US$0.75-0.78 over the next two years. However, with prospects of a widening interest rate differential in favour of the U.S. and faster economic growth in the U.S. than Canada going forward, the Canadian dollar may be submitted to downward pressure at times. We therefore think that business should make their plans based on the expectation that the Canadian dollar will move in the lower range of US$0.73-0.77 in 2016 and 2017.
Section II: Canadian Competitiveness: 2005-2015
The relatively subdued projection for Canadian growth over the next couple of years, 2+ percent at annual rates, continues the trend deceleration of Canadian growth observed this century. In part this is due to demographic factors as the baby boom generation retires (See our earlier Fall 2014 Outlook). But in part it is due to the weak performance of labour productivity growth relative to the U.S., which depressed cost competitiveness. Canada's loss of competitiveness has in addition been a consequence of stronger commodity prices which led to an appreciation of the Canadian dollar. On net, the stronger commodity prices stimulated economic growth through gains in real income and investment that more than offset the impact of weaker competitiveness. Nevertheless, this loss of competitiveness continues to depress Canadian net exports and hence real GDP, although to a decreasing extent recently. The purpose of this section is to analyze the factors that have contributed to the loss of Canadian competitiveness over the last decade. We conclude the section with an assessment of the prospects for improvement in our competitiveness over the next few years.
The loss of Canadian cost competitiveness depressed Canadian real net exports and hence real GDP. Along with the increased presence of China as a competitor in the U.S. market, it contributed to a fall in Canada's market share of U.S. manufacturing imports. The loss of Canadian competitiveness along with generally faster growth of domestic demand in Canada than in the U.S. contributed to a significant deterioration of Canada's current account balance relative to GDP since 2005, more than offsetting the effect of a mild improvement in our terms of trade during most of the period.
Competitiveness matters for growth. In order to better appraise how competitive we are likely to be in the future, it is important to understand how Canadian competitiveness has evolved and why. Therefore this section: (1) compares the growth rates of prices and unit costs in Canada and the U.S. over the last decade; (2) assesses the degree of cost competitiveness prevailing at the moment; (3) reviews the key drivers of the Canadian dollar exchange rate and the Canada-U.S. differential in labour productivity growth, the two main factors that have driven changes in Canadian competitiveness; and (4) examines the chance of regaining further competitiveness in the next few years.
Costs and Prices in the Business Sector: Canada vs the U.S.
At the aggregate level, competitiveness can be measured by comparing across countries prices or unit costs for real output in the business sector, expressed in the same currency. The most common measure compares unit labour costs in Canada with the U.S. Canada's competitiveness in terms of unit labour costs with the U.S. evolves in response to three main factors:
- the exchange rate of the Canadian dollar, an appreciation of which pushes Canadian costs in U.S. dollars up relative to U.S. costs;
- growth in hourly labour compensation in domestic currency relative to the U.S.; and
- growth in labour productivity, or real value-added (GDP) per hour worked, relative to the U.S.
Competitiveness can also be measured in a more inclusive way by comparing across countries' aggregate business prices in a common currency. Prices used for this purpose can be broken down into two broad components: unit labour costs and unit non-labour payments, the latter including unit profits or net operating surplus in addition to other elements.1 Thus, a measure of competitiveness based on relative business prices would reflect the Canadian dollar exchange rate, relative unit labour costs and relative unit non-labour payments. Table 1 presents the evolution of Canadian competitiveness in terms of costs and prices over the last decade.
Because a change in competitiveness in any given year affects real economic activity over two to three years, changes in three-year moving averages of prices and costs in Canada relative to the U.S. likely provide better indications of the competitive pressures that are brought to bear on economic activity in any given year than actual yearly changes. Therefore the figures in Table 1 are based on three-year moving averages of yearly figures.
Table 2: Costs and Prices in the Business Sector: Canada vs the U.S.
(Annual growth rates of 3-year moving averages in %)
| 2005-2011 | 2012-20154 | 2005-20154 | |||||||||||||||||||||||||||||||||||||||||||||||||||||||||||||||||||||||||||||||||||||||||||||||||||||||||||||||||||||||||||
| Canada | U.S. | Canada | U.S. | Canada | U.S. | ||||||||||||||||||||||||||||||||||||||||||||||||||||||||||||||||||||||||||||||||||||||||||||||||||||||||||||||||||||||||
|---|---|---|---|---|---|---|---|---|---|---|---|---|---|---|---|---|---|---|---|---|---|---|---|---|---|---|---|---|---|---|---|---|---|---|---|---|---|---|---|---|---|---|---|---|---|---|---|---|---|---|---|---|---|---|---|---|---|---|---|---|---|---|---|---|---|---|---|---|---|---|---|---|---|---|---|---|---|---|---|---|---|---|---|---|---|---|---|---|---|---|---|---|---|---|---|---|---|---|---|---|---|---|---|---|---|---|---|---|---|---|---|---|---|---|---|---|---|---|---|---|---|---|---|---|---|
| Unit labour costs in domestic currency | 2.6 | 1.0 | 1.7 | 1.1 | 2.3 | 1.1 | |||||||||||||||||||||||||||||||||||||||||||||||||||||||||||||||||||||||||||||||||||||||||||||||||||||||||||||||||||||||
| Hourly Compensation | 3.4 | 2.6 | 2.9 | 1.5 | 3.2 | 2.2 | |||||||||||||||||||||||||||||||||||||||||||||||||||||||||||||||||||||||||||||||||||||||||||||||||||||||||||||||||||||||
| Labour productivity | 0.9 | 1.6 | 1.3 | 0.3 | 1.1 | 1.1 | |||||||||||||||||||||||||||||||||||||||||||||||||||||||||||||||||||||||||||||||||||||||||||||||||||||||||||||||||||||||
| Unit non-labour payments in domestic currency1 | 2.3 | 2.7 | 1.7 | 0.6 | 2.1 | 1.9 | |||||||||||||||||||||||||||||||||||||||||||||||||||||||||||||||||||||||||||||||||||||||||||||||||||||||||||||||||||||||
| Unit capital costs2 | 3.7 | 1.7 | 3.0 | ||||||||||||||||||||||||||||||||||||||||||||||||||||||||||||||||||||||||||||||||||||||||||||||||||||||||||||||||||||||||||
| Unit net operating surplus3 | 1.8 | 1.2 | 1.6 | ||||||||||||||||||||||||||||||||||||||||||||||||||||||||||||||||||||||||||||||||||||||||||||||||||||||||||||||||||||||||||
| Basic price in domestic currency | 2.3 | 1.7 | 1.6 | 0.9 | 2.1 | 1.4 | |||||||||||||||||||||||||||||||||||||||||||||||||||||||||||||||||||||||||||||||||||||||||||||||||||||||||||||||||||||||
| Canadian dollar exchange rate | 4.4 | -1.6 | 2.2 | ||||||||||||||||||||||||||||||||||||||||||||||||||||||||||||||||||||||||||||||||||||||||||||||||||||||||||||||||||||||||||
| Unit labour costs - US$ | 7.1 | 1.0 | 0.0 | 1.1 | 4.5 | 1.1 | |||||||||||||||||||||||||||||||||||||||||||||||||||||||||||||||||||||||||||||||||||||||||||||||||||||||||||||||||||||||
| Unit non-labour costs - US$ | 6.7 | 2.7 | 0.1 | 0.6 | 4.3 | 1.9 | |||||||||||||||||||||||||||||||||||||||||||||||||||||||||||||||||||||||||||||||||||||||||||||||||||||||||||||||||||||||
| Basic prices - US$ | 6.8 | 1.7 | 0.0 | 0.9 | 4.3 | 1.4 | |||||||||||||||||||||||||||||||||||||||||||||||||||||||||||||||||||||||||||||||||||||||||||||||||||||||||||||||||||||||
The last decade can be neatly separated into two sub-periods: one of substantial deterioration of Canadian competitiveness over 2005-2011 and one of moderate improvement in competitiveness over 2012-2015. In each case, movements in the Canadian dollar exchange rate were by far the most important drivers of changes in competitiveness. Over 2005-2011, unit labour costs in domestic currency grew much faster in Canada (2.6 percent) than in the U.S. (1.0 percent) because of larger increases in hourly compensation (by 0.8 percent) and slower labour productivity growth (by 0.6 percent). At the same time, unit non-labour payments in domestic currency advanced less rapidly in Canada (2.3 percent) than in the U.S. (2.7 percent). A comparatively subdued rise in unit net operating surplus (1.8 percent), reflecting a compression of margins in 2009-2011, limited the rise in these payments in Canada. On net, basic prices in domestic currency progressed more rapidly in Canada than the U.S. by 0.6 percentage points. What really depressed Canadian competitiveness over 2005-2011 was a strong appreciation of the Canadian dollar exchange rate relative to the U.S. dollar (4.4 percent). This appreciation accounts for 72 percent and 86 percent of the loss of competitiveness in terms of unit labour costs and prices respectively. Indeed, unit labour costs in U.S. dollars rose 6.1 percentage points faster in Canada than in the U.S. every year and basic prices 5.1 percentage points faster. Canadian business prices and unit costs in Canadian dollars continued to rise faster than business prices and costs in the U.S. over 2012-2015, notwithstanding stronger productivity growth in Canada than in the U.S. At 1.3 percent (on a three-year moving average basis), Canadian labour productivity growth was on par with its pre-crisis long-term average over 1984-2007 whereas U.S. productivity growth, at 0.3 percent (on a three-year moving average basis), was much lower than its 1984-2007 average of 2.3 percent. However, the Canadian dollar exchange rate reversed its course over 2012-2015, depreciating at a third of the speed it appreciated over the previous seven years (-1.6 percent versus 4.4 percent) when measured on a three-year moving average basis to take account of the lags in the effects of exchange rate changes. As a result, business prices and unit labour costs in U.S. dollars were essentially flat in Canada over 2012-2015 whereas they increased by about one percent per annum in the U.S., again when measured on a three-year moving average basis. Relative Levels of Competitiveness in 2004-2015Comparing Canada and U.S. growth rates in unit labour costs or business prices in U.S. dollars on a yearly basis or even on a three-year moving average basis permits us to trace changes in Canadian competitiveness but does not provide a clear indication of how significant the loss of competitiveness has been at different points in time. For this purpose, the relative Canada-U.S. levels of prices and costs preferably need to be compared to those prevailing during a relatively long period in which, on average, the amount of excess demand or slack in the economy and the current account balance in relation to GDP were small. The period 1984-2005 roughly meets these criteria and can be used to benchmark the evolution of Canadian cost competitiveness over the last decade.2 Measured in terms of unit labour costs (in US$) in Canada versus the U.S. relative to the 1984-2005 average, a loss of Canadian cost competitiveness in the business sector emerged in 2004 (4.5 percent). This loss (represented by the purple line in Chart 1) grew to a peak of 51 percent in 2011 before retreating to 21 percent by the first half of 2015 as the Canadian dollar depreciated against its U.S. counterpart (green bars in Chart 1). 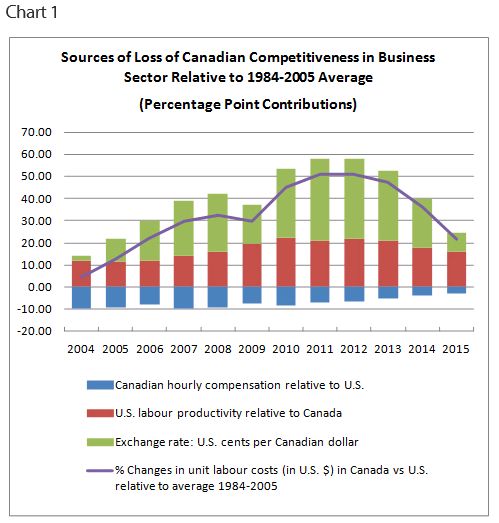
It is worth noting that the positive contributions of the exchange rate (green bars) and labour productivity (red bars) factors to the loss of Canadian competitiveness increased in the period 2005-2011 and decreased during the period 2012-2015, whereas the partial offset provided by the hourly compensation factor gradually diminished after 2007 (blue bars in Chart 1). The erosion of the productivity differential effect over the last four years essentially arises from a downward shift in U.S. productivity growth, which has been absent in Canada (Chart 2). This downshift in actual productivity growth would primarily reflect a downshift in trend productivity growth which occurred in the mid-2000s following a decade of high trend productivity growth fuelled by rapid production and adoption of information and communications technologies (ICT).3 U.S. productivity growth (red line in Chart 2) averaged 1.7 percent per year over 1984-1995, jumped to 3.1 percent over 1996-2005 and fell to 0.7 percent over 2006-2015 (excluding 2009 and 2010). By comparison Canadian productivity growth (blue line) averaged 1.3 percent over 1984-2015, with little evidence of changes in trend productivity growth. 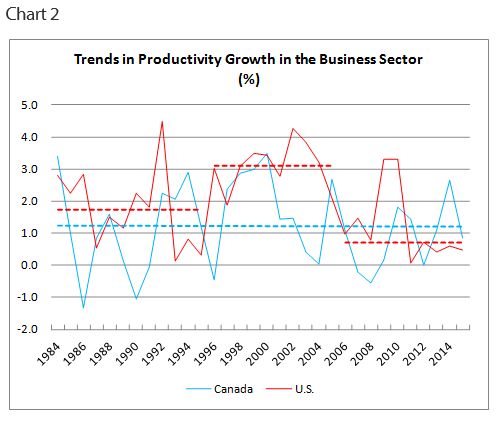
On average over 2005-2015, the evolution of the Canadian dollar exchange rate relative to 1984-2005 accounts for 70 percent of the loss of Canadian cost competitiveness relative to 1984-2005. Relative labour productivity accounts for another 55 percent of that loss whereas relative hourly compensation reduced it by 25 percent. Currently, Canadian cost competitiveness would be lower than in any year between 1991 and 2007 in spite of appreciable gains since 2011. The loss of 21 percent as at the first half of 2015 is largely accounted by a lower relative productivity level in Canada than in 1984-2005 (75 percent) and to a lesser extent by a stronger Canadian dollar than in 1984-2005 (40 percent). A lower relative compensation level in Canada than in 1984-2005 mitigates this loss (-15 percent). As will be discussed later, the prospects of gains in Canadian competitiveness in the short term because of more rapid productivity growth in Canada than in the U.S. look good in light of the recent low level of U.S. trend productivity growth. Drivers of Canadian Dollar Exchange RateThe Canadian dollar has two main drivers: the evolution of commodity prices, especially oil prices, and the Canada-U.S. interest rate differential. The net appreciation of the Canadian dollar during 2005-2011 was largely caused by a sharp rise in international oil prices (Chart 3). Likewise, the fall in oil prices in 2014 and 2015 importantly contributed to the depreciation of the Canadian dollar during these two years. In fact, movements in the Canadian dollar have tracked those in the WTI oil price in the last 30 years, and especially since 2000. Canada-U.S. interest rate differentials have had a relatively minor effect on the exchange rate since the late 1990s. International oil prices boost the value of the Canadian dollar not because they raise Canada's trade surplus immediately but because they prompt capital inflows into Canada in expectations of the positive effects of higher oil prices on corporate profitability, economic growth, oil exports and foreign direct investment in the oil and gas sector. In other words, by boosting expectations of a stronger Canadian dollar in the future, rising oil prices drive the Canadian dollar higher immediately via capital inflows. 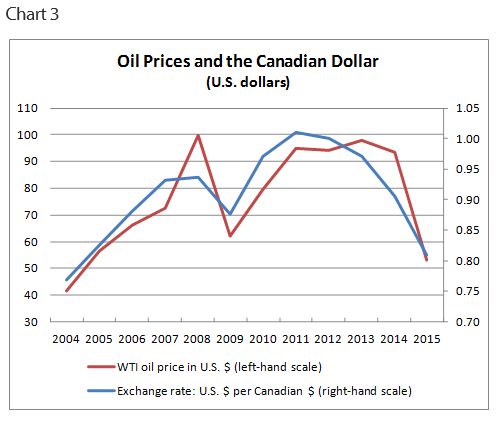
Drivers of Canada-U.S. Productivity Growth DifferencesLabour productivity growth responds to a complex set of factors that operate through investment in tangible and intangible assets, which itself is conditioned by competitive pressures, firm size, multinational orientation, managerial quality, education and relative wages of the labour force, and several other factors. Disentangling the contributions of these various factors is extremely difficult. Growth accounting is a simple framework, based on specific but plausible economic assumptions, that decomposes labour productivity growth into three broad components:
Over the period 1988-2013, for which growth accounting data are available for both Canada and the United States, labour productivity growth for the business sector was systematically faster in the U.S. than in Canada, largely because of stronger growth in multifactor productivity in the U.S. (Table 3).4 These characteristics were even more pronounced over 2003-2013. During this period, productivity growth in Canada (0.80 percent) was largely supported by growth in capital intensity (0.99 percent) and to lesser extent improvement in labour composition (0.24 percent). Multifactor productivity actually fell considerably (-0.44 percent). In contrast, half of the growth in U.S. labour productivity over the same period was accounted by multifactor productivity. Improvement in labour composition had about the same effect as in Canada whereas growth in capital intensity was less pronounced. It is worth noting that in the U.S. and even more so in Canada, the contribution of labour composition to productivity growth has slowed markedly from 1988-2002 to 2003-2013. For both countries, this seems to reflect in part a prolonged trend decline in the pace at which the average level of education of the workforce rises over time. This is likely to continue into the medium term. The gap in labour productivity growth between Canada and the U.S. has been particularly large during and immediately after economic downturns (Chart 2), with U.S. productivity growth showing considerable firmness, for example over 2007-2010 or 1989-1991. U.S. firms appear to have been much more aggressive in shedding surplus labour and adopting labour-saving technologies than Canadian firms when facing a slowdown of activity. The reason for this is not entirely clear. In part this may be because firms are larger in the U.S. than in Canada or face more pressure to maintain good financial results. In any event, the contribution of capital intensity to labour productivity growth climbed far more in the U.S. than in Canada during recession years, for example 2009 and 2001. A sharper rise in capital intensity is to be expected if labour shedding is more severe. One last observation on recent trends: the marked weakness of U.S. labour productivity growth over 2011-2015 shown in the quarterly data on prices and costs (on which Table 2 figures are based) suggest that over these recent years the Canada-U.S. gap in multifactor productivity growth would have narrowed dramatically, with U.S. multifactor productivity growth possibly turning weaker than Canadian. Does that reflect a pause or even a permanent reduction in the pace of innovation in the U.S., as some suggest? We do not know and there is a sharp division of speculative views among analysts. Table 2: Costs and Prices in the Business Sector: Canada vs the U.S.(Annual growth rates of 3-year moving averages in %)
|
|||||||||||||||||||||||||||||||||||||||||||||||||||||||||||||||||||||||||||||||||||||||||||||||||||||||||||||||||||||||||||||
The slower pace of multifactor productivity growth in Canada than in the U.S. (until very recently at least) means that the efficiency with which businesses have combined labour and capital to produce value-added in the production of goods and services has grown more slowly in Canada than in U.S. At the most fundamental level this reflects in part a slower pace of innovation creation or adoption in Canada, be it technological, organizational or promotional. As a result, the methods of production would be less efficient (lower labour productivity) and the unit costs of production higher (lower competitiveness) in Canada. Moreover, the creation and production of improved, different or entirely new products would be slower than the U.S. In many cases, this would restrain growth in domestic sales, exports and profits by Canadian businesses, thereby growth in value-added per hour worked (i.e., labour productivity) relative to the U.S. There are no direct ways to properly estimate the contribution of the "innovation" component of the multifactor productivity growth differential between Canada and the U.S. However, indicators of investment in intangible capital (e.g., investment in R&D) support the view that innovation creation and adoption are less vibrant in Canada than in the U.S. For instance, the contribution of real investments in machinery and equipment and intellectual property to real GDP growth has been significantly smaller in Canada (Table 2).
Another factor that may have contributed to slower multifactor productivity growth in Canada than in the U.S. was massive investment in the oil and gas sector in Canada, which likely boosted the contribution of capital intensity to labour productivity growth in the business sector without significantly affecting that same productivity growth.5 The result would have been a fall in (residual) multifactor productivity growth in the business sector. Thus massive investment in oil and gas extraction may have contributed to the sharp deterioration of multifactor productivity growth and firmness in the contribution of capital intensity in the Canadian business sector relative to the period 1988-2002 and relative to the U.S. (Table 2).
It is worth noting that in both Canada and the U.S. the contribution of ICT6 capital intensity to labour productivity growth slowed substantially between 1988-2002 and 2003-2013.7 However, in the U.S. it slowed more than in Canada and was not offset to the same degree by a rising contribution of capital intensity in the oil and gas industry. This would be another reason why the contribution of capital intensity slowed in the U.S., but not in Canada, between 1988-2002 and 2003-2013.
Prospects for Gains in Canadian Competitiveness in the Short Term
In assessing prospects for gains in Canadian competitiveness, there are three factors to consider:
- the Canadian dollar exchange rate;
- hourly compensation growth in Canada relative to the U.S.; and
- labour productivity growth in Canada relative to the U.S.
As discussed earlier, the Canadian dollar exchange rate is likely to move within the US$0.73-0.77 range over the next two years principally based on our assumptions about WTI oil prices. An average level of US$0.75 would provide a gain in competitiveness of about eight percent relative to the first half of 2015 (2015H1).
Hourly compensation growth (in Canadian dollars) in the Canadian business sector has systematically exceeded that in the U.S. (in U.S. dollars) by 0.7 percentage points since 2004. With faster economic growth and a tighter labour market in the U.S. than in Canada in the short term, this gap may narrow and could even change direction if Canadian businesses and governments manage carefully. On the other hand, if labour productivity growth in the U.S. was to remain weak relative to Canada, real compensation growth in the U.S. might tend to decline relative to Canada, thereby offsetting the impact of a tighter labour market in the U.S. In this case, the gap in hourly compensation growth might not close at all and could even expand. Balancing the risks, we can assume that the gap will remain at its average of 0.7 percentage points, and therefore the same level as in the first half of 2015 (2015H1). Thus, relative to 2015H1, no gain or loss of competitiveness is assumed to arise from the relative evolution of hourly compensation in domestic currency in the short term.
Regarding the productivity growth differential between Canada and the U.S., it has been in favour of Canada by an average of 0.7 percentage points since 2010, reflecting a systematically weak rate of U.S. productivity growth by historical standards. Canadian productivity growth was only slightly below its long-term average by contrast. The odds are that in the short term U.S. productivity growth will remain close to its 2006-2015 trend rate (see Chart 3) while Canadian productivity growth will be close to its long-term average, if not a bit stronger if Canadian businesses and governments manage well. Thus, with U.S. and Canadian productivity growing at 0.7 percent and 1.3 percent respectively, the productivity growth differential in favour of Canada would widen by 0.2 percentage points relative 2015H1 (0.6 percent versus 0.4 percent).
If the above assumptions were to materialize, the loss of Canadian cost competitiveness relative to the benchmark 1984-2005 period would be nearly cut in half in the short term, falling from 21 percent in 2015H1 to 12 percent in 2016 and 2017, the lowest level since 2004. Of the nine percentage points (p.p.) decline, over eight p.p. would come from a weaker Canadian dollar and nearly two p.p. from improved Canadian productivity relative to the U.S. Relative hourly compensation (blue bars in Chart 1) would contribute to reduce the level of competitiveness in the next two years by over one p.p. Overall the gain in competitiveness would support Canadian economic growth.
The above scenario is not a forecast. Rather, it is an assessment of the potential gain in competitiveness that could be obtained if low oil prices and weak U.S. productivity growth persist in the short term. Given high uncertainty about the future evolution of these two factors, this assessment is not without substantial risks. Nevertheless, it suggests that there is a definite opportunity for Canadian businesses to recapture competitiveness not just through a weaker Canadian dollar but also through stronger productivity growth than in the U.S. In the above exercise this comes about from a continuation of the recent weak trend productivity growth in the U.S., but it could also come from a rise in trend productivity growth in Canada, which would be a far better outcome since it would tend to boost domestic real income at the same time. To raise trend productivity growth, however, Canadian businesses would need to invest more in machinery and equipment, software, labour training and research and development, and most importantly to innovate more in terms of new processes, new products, better organization and improved marketing. From a historical comparison with the U.S. with respect to multifactor productivity growth (Table 3 for example), it is difficult to escape the impression that Canadian business culture and practises in general have been less innovative, entrepreneurial and risk-taking than the U.S. But there are Canadian firms that are agile, i.e., they can spot opportunities early and adapt in real time to market and technological shifts. The more widespread their strategies and behaviours will become, the more favourable the prospects for higher productivity growth in the Canadian business sector will become.8
Section III: Trade Developments and Negotiations
Slow Trade Growth
Following similar analysis to that in Section I, WTO economists on September 30 "lowered their forecast for world trade growth in 2015 to 2.8%, from the 3.3% forecast made in April, and reduced their estimate for 2016 to 3.9% from 4.0%." Furthermore they saw risks to the forecast as firmly on the downside.
The WTO notes in the same statement that, "If current projections are realized, 2015 will mark the fourth consecutive year in which annual trade growth has fallen below 3 per cent and the fourth year where trade has grown at roughly the same rate as world GDP, rather than twice as fast, as was the case in the 1990s and early 2000s."
One factor that could contribute to rejuvenating world trade in the medium term would be significant trade liberalization. The remainder of this section examines the prospects of achieving such liberalization through trade agreements both globally and for Canada in particular.
Trade Negotiations – Positive Developments but Not There Yet
There have been two major positive developments since our Spring Outlook. First, on June 29 President Obama signed into law an act of Congress providing Trade Promotion Authority to the Administration. Second, on October 5 the 12 nations participating in the Trans-Pacific Partnership negotiations reached agreement at Ministerial level in Atlanta. Subsequently the text of the agreement in English was released publicly on November 5.
In this section we will report on initial reactions to the text and take a look at the process for ratification, including how long that might take. We will also consider the prospects for implementation of the CETA with the E.U., launching negotiations with China and strengthening our relationship with NAFTA partner Mexico. Finally we will take a look at developments in the WTO including what might be in store at the December Ministerial Conference in Nairobi.
Implementing new trade agreements would help promote Canadian competitiveness. To understand the potential effect on competitiveness it is important to examine whether these agreements and negotiations can be converted into real liberalized trade and within what timeframe.
United States Trade Promotion Authority (TPA)
In our Spring Outlook we noted the importance of the debate in the U.S. Congress on TPA. The passage of TPA is a key milestone in restoring momentum to global efforts to liberalize trade.
This legislation provides the President with wide ranging authority to conduct trade negotiations and bring trade agreements back to the Congress for approval through a procedure, known as fast track, that would not allow amendments to the implementing legislation nor to the agreements themselves. The act also provides a series of far reaching trade negotiating objectives for the U.S., together with procedures for consultation with the Congress prior to initiation of a negotiation and during its conduct.
This authority gives President Obama, and his successor, the power to initiate and enter into trade agreements until July 1, 2018, or through an extension procedure until to July 1, 2021. This authority also covers certain negotiations already initiated including the Trans-Pacific Partnership (TPP).
Such authority was essential for creating an environment in which trading partners of the U.S. are prepared to put meaningful concessions on the table in the knowledge that the Administration has the authority to conclude trade agreements and a clear pathway for bringing them into force.
The Trans-Pacific Partnership (TPP) Agreement
As noted above the TPP text has now been released. All interested parties can now see what is in the agreement, although the text is still subject to legal review and will be translated into French and Spanish language versions prior to signature. The agreement is complicated, drafted in trade treaty language and covering more than 6000 pages, plus 122 side letters.
In most countries the main immediate beneficiaries of the TPP will be businesses and producers of various goods and services. Their support will be key to getting approval of the agreement and the legislation necessary to implement it. Nowhere will this be truer than in the U.S. Various groups will oppose the TPP. To overcome the effect of this opposition in Congress will require the very strong support from the business community. How strong that support will be is not yet clear. Most business groups were supportive of the TPP negotiations and welcomed their conclusion and the release of the text. However, most of them have refrained from passing judgment on the text while they review the contents. To give an example, the U.S. Coalition for TPP (the main business group formed to lobby for the TPP) issued a press release saying, inter alia:
While it will take some time to examine and absorb the agreement, the U.S. Coalition for TPP is encouraged to see many chapters that address trade barriers and the type of rules that are important to create a level playing field and advance American competitiveness in the 21st century.
The final agreement is worthy of serious review. If it meets our high expectations, it has tremendous potential to improve America's competitiveness around the world.
Some agricultural sectors like pork have already expressed strong support but others like, for example, the leading pharmaceutical companies have said the TPP is not ambitious enough in providing intellectual property protection. In addition some analysts have suggested that the disciplines for state-owned enterprises fall short of what many American business leaders wanted to see.
When the battle lines are drawn, business will certainly push Congress to pass the TPP but how hard they push will be critical to the outcome. Congress is clearly split on the issue. Election year politics will not make matters easier.
How quickly can Congress address the TPP and will it be able to vote on it before the U.S. 2016 election? The TPA provides the basic framework for how the process should work. Three requirements among many would seem to be the most significant.
First, on November 5 the President gave the 90-day notice of his intention to sign the TPP. This means he cannot sign it before February 3, 2016. Reports on the TPP leaders meeting in Manila on November 18 suggest that they are nearing consensus on a proposal to sign the agreement on February 4 in New Zealand, but have not yet agreed to that date.
Second, part of the process involves a report by the U.S. International Trade Commission (ITC) on the economic impact of the TPP on the U.S. The report must be submitted to Congress within 105 days of the signature of the agreement, i.e., if the President signs on February 3, by May 18. Perhaps it could be done faster but the task is complicated and the TPA has just given the ITC additional time for this task. In a notice of investigation issued on November 17 the ITC listed May 18 as the "anticipated date" for the transmission of its report to Congress and the President.
Third, the President would need to submit the implementing package to Congress which starts the real fast track process. Before doing that, the President would probably follow established practice and have senior officials conduct a "mock markup" with the Senate Finance Committee and the House Ways and Means Committee, which would give members of both committees the opportunity to provide advice on the contents and wording of the implementing bill before the President formally sends the bill to Congress. This discretionary process helps secure passage but would take a certain amount of time. It is designed to accommodate for the fact that once the bill is formally submitted to Congress no amendments can be made to it. Let us assume the President submits the implementing package at the end of May. The 45 "session" days given to the committees of each house to consider the legislation would mean it would probably be late August before the bill was cleared for floor action. Given Congressional recesses it seems unlikely that a vote would occur before the election. Another complicating factor is that the national presidential nominating conventions of the Republicans and Democrats will take place in the second half of July. Possibly the vote could be scheduled for the lame duck session after the election but that could be risky. Alternatively it might fall on the next President to submit or resubmit the implementing package to Congress.
To paraphrase Churchill, the fate of the TPP in the US Congress is a riddle, wrapped in a mystery inside an enigma. At this stage it is not realistic to attempt a prediction of exactly what will happen.
Canada and the TPP
The new Canadian government's position to review the TPP agreement and engage in a consultative process is a reasonable one given the complexity of the agreement and the fact that the negotiations on it were completed by the previous government. Indeed this position was welcomed by Canada's TPP partners in the TPP Leaders Statement on November 18.
However, quite soon the government will come under pressure to clarify whether it intends to support the agreement. In particular, Canada would need to decide whether to sign the TPP along with other parties if, as appears likely, a signing ceremony is organized in New Zealand on February 4. It would be a communications challenge for the government to sign the agreement but assert they were still consulting with Canadians on whether the government should support it or not. One option might be to set a date by which the government would decide its position, say, by May 1 before President Obama sends the implementing bill to Congress.
After signature the parties will proceed to ratification.
Given the scenario for Congressional consideration described above, there is ample opportunity to hold parliamentary hearings as part of the ratification process, before Parliament would need to decide whether to approve the TPP and make the necessary changes to Canadian law to implement it.
The government might decide to wait and see what the outcome was in the U.S. before seeking parliamentary approval. However, there might be good reasons for moving ahead of the U.S. It would also familiarize members of parliament with the agreement which could be useful in reacting to the political debates on TPP in the U.S. It would also demonstrate to all our TPP partners the new government's commitment to liberalizing trade. In addition, it would provide the U.S. President with some positive momentum for passage, particularly if Mexico also ratified the agreement in the same time frame.
By its terms the TPP cannot come into effect without U.S. (and Japanese) participation. The agreement would come into effect 60 days after the ratification procedures have been completed by all 12 countries. It seems unlikely that all the other members will ratify before the U.S. does. So clearly, the earliest the agreement would come into force would be sometime in 2017. If one or more parties are slow in ratifying the agreement, the earliest it could come into force is two years and 60 days after the date of signature, if at least six countries accounting for 85 percent of the GDP of all the original signatories have completed their ratification procedures. Under such a scenario the TPP would come into force no earlier than the spring of 2018. In this context we note a further reason for the Canadian government to be ready to ratify when the U.S. and Japan are ready: once the agreement has entered into force as a result of ratification by less than the full 12 signatories, it can only enter into force for additional original signatories with the approval of the TPP Commission. In other words, the negotiators have built into the Entry Into Force provisions an incentive not to be late to the party.
Finally, we offer our initial thinking on why Canada should accept the TPP and implement it enthusiastically. While like others we continue to analyze the details of the agreement, we consider that it would over time bring significant productivity and profitability benefits to many Canadian producers of goods and services and to Canadian consumers in the form of increased choice and lower prices. In particular we think that the new export opportunities, access to cheaper intermediate goods and services and increased ability to participate in global supply chains will enhance the productivity and competitiveness of Canadian business while increasing competition in the domestic market to the benefit of consumers.
Of course, the potential benefits need to be looked at against the potential costs. That will certainly be done as the debate about Canadian acceptance of the TPP unfolds. But we also need to look at the very sizable costs of not participating and bear in mind that while Canada would still have a free trade agreements with the TPP countries of the Western hemisphere it would have no free trade agreement with Asian TPP members.
If Canada were to stand aside we would see our exports of agricultural products to Asian TPP countries shrivel and that would include our $4.1 billion in annual sales of agri-food products to Japan.
Some cite the automotive provisions of the TPP as a reason for not participating. Frankly the horse has already left the barn. The automobile assemblers and the big auto parts manufacturers in Canada are already part of an evolving system of global supply chains. Furthermore, maintaining access to the U.S. automotive market needs to remain the key Canadian trade priority in this sector. If Canada did not join the TPP and kept NAFTA rules of origin for sales to the U.S. we would lose out to TPP suppliers in Asia and Mexico who would enjoy more liberal rules of origin in their sales to the U.S. That would clearly be a major disincentive to new investment in the Canadian automotive sector.
CETA
This landmark agreement between Canada and the E.U. was concluded on August 1, 2014, and the text was made public at the end of September 2014. Work continues on translating the agreement into French and the other 22 languages of the E.U.. In the E.U., calls for the renegotiation of the provisions on investor state dispute settlement continue and come from politically influential quarters. This issue has now become a key stumbling block in the E.U.-U.S. TTIP negotiations, further complicating the road to CETA ratification. Another problem is that officials have not yet been able to resolve a number of key regulatory issues that would determine whether Canadian agricultural producers would be able to take full advantage of the agreement. In our Outlook a year ago we said it would be 2017 before Canadian business began to benefit from the agreement. The slow pace of the implementing work to date is worrying. As one European diplomat put it to us, the TTIP negotiations with the U.S. have sucked all the air out of the room. We think it will be necessary for the new government to give CETA a strong political push before it will be ratified. We now believe it will be 2018 before any benefits are seen by Canadian exporters.
China
The Prime Minister has flagged as a top priority the development of a targeted strategy to promote trade and investment with China, Canada's second largest trade partner. This would be an opportune moment to prepare the ground for the negotiation of a free trade agreement. While some Canadians are concerned about the impact of an FTA with China, the government could mitigate this by announcing that it intends to negotiate an FTA with China but by simultaneously launching a process of consultations with Canadians on how the negotiations should be conducted. This would also give the government and the business community an opportunity to build the case for why such an agreement makes sense.
Just as the potential costs of not participating in the TPP would be high, the potential costs of not securing an expanded trade and investment arrangement with China will be high. Australia, one of Canada's major competitors, already has a high-quality FTA with China, and New Zealand also has an FTA with China. This is a powerful argument as to why Canada should move without further delay.
It is expected that China would be interested in such a negotiation. If Canada were to use the Australia-China agreement as a sort of template, it might be possible to negotiate an agreement fairly quickly.
Mexico
In our Fall 2014 Outlook we said the time had come to strengthen Canada's relationship with Mexico for the 21st century. The new government has now established as a top priority strengthening North American cooperation with the U.S. and Mexico. Lifting the Mexican visa requirement has been identified as one element of this process.
This development offers a very significant economic opportunity to begin to derive full benefit from our free-trade relationship with Mexico, one of the world's most successful emerging markets.
WTO
The bright spot on the WTO landscape is the Trade Facilitation Agreement (TFA) which was concluded at the Ministerial Conference in Bali in December 2013. The TFA is essentially a multilateral framework for reducing trade costs. The Protocol of Acceptance was opened in November 2014 and has been ratified so far by 53 WTO Members including the U.S., the E.U., Japan and China, but not yet Canada. The TFA will come into force when ratified by two thirds of the WTO Members, which is 108 Governments.
Unfortunately other WTO news is less upbeat. Not surprisingly, virtually no progress has been realized in advancing the WTO's Doha Round negotiations in the run-up to the December Ministerial Conference in Nairobi. The U.S. and the E.U. are both starting to make it clear that post-Nairobi they will not be prepared to engage in further negotiations within the framework of the Doha Declaration, thus ending any prospect that these negotiations will ever be concluded as envisaged in Doha 14 years ago.
Perhaps, most important, ministers in Nairobi will begin to rejuvenate the WTO's negotiating function by reorienting the WTO work program to address the new challenges of the 21st century while not losing sight of major outstanding issues such as the reform of agricultural trade.
Plurilateral Negotiations
Three sets of significant plurilateral negotiations are currently underway with links to the WTO. Such negotiations may help fill gap left by the failure of WTO Members to advance and conclude the Doha negotiations.
A group of members in the 1996 WTO Information Technology Agreement (ITA) have agreed to expand the coverage of the agreement by an additional 201 products and hope to be able to announce their plans for implementation at the Nairobi Conference this month. The plan is to remove the majority of the tariffs on these products within three years, with reductions likely beginning in mid-2016. The WTO has estimated that annual trade in these 201 products is valued at over US$1.3 trillion per year, and accounts for approximately seven percent of total global goods trade.
The Trade in Services Agreement (TiSA) negotiations is an effort by 23 countries accounting for 75 percent of the world's $44-trillion services market to expand and improve on the provisions of the WTO Agreement on Trade in Services. This negotiation is taking place in Geneva but outside the WTO and does not include China.
Negotiations on the Environmental Goods Agreement (EGA) were initiated in July 2014, among the U.S., Australia, Canada, China, Costa Rica, the E.U., Hong Kong, Japan, Korea, New Zealand, Norway, Singapore, Switzerland and Chinese Taipei. These countries account for 86 percent of global trade in environmental goods, estimated at some US$1 trillion annually.
Notes
Output is measured as real value-added (GDP) at basic prices, i.e., output excludes the value of intermediate materials, and prices exclude taxes and subsidies on products. Unit labour costs account for about 52 percent of basic prices in the business sector in Canada. Unit net operating surpluses account for about 30 percent and unit capital costs for another 18 percent.
It is important to note that the 1984-2005 average does not (necessarily) represent the level of relative unit labour costs that would be consistent with absence of slack in the economy or balanced current account at the present time.
For a rigorous analysis of trends in U.S. productivity growth, see J.G. Fernald, "Productivity and Potential Output Before, During, and After the Great Recession", Federal Reserve Bank of San Francisco, Working Paper 2014-15, June 2014.
Growth accounting data lag behind data on labour productivity and unit labour costs that are produced on a quarterly basis in Canada and the U.S. as part of the economic accounts. They do not reflect the latest revisions to the data that go into the making of the growth accounting figures. Therefore, there is no full consistency between the data in Table 1 and those in Table 2, although the discrepancy is not large. The data on which Table 1 is based show labour productivity growth rates over 2003-2013 of 0.7 percent and 1.8 percent for Canada and the U.S. respectively compared with 0.8 percent and 1.9 percent in Table 2.
The contribution of oil and gas extraction to labour productivity growth in the business sector was nil over 2000-2012. This is because a fall in within-sector productivity level due to a shift to unconventional methods was offset by a reallocation of labour to the oil and gas sector, whose productivity level is relatively very high. For estimates of contributions of oil and gas extraction to labour productivity growth in Canadian business sector over 2000-2012 see A. Sharpe and B. Waslander, "The Impact of the Oil Boom on Canada's Labour Productivity Performance, 2000-2012", International Productivity Monitor, Centre for the Study of Pving Standards, Fall 2014.
ICT capital refers to capital in information and communications technologies, including software.
See Gilbert Cette, Christian Clerc and Lea Bresson, "Contribution of ICT Diffusion to Labour Productivity Growth:The United States, Canada, the Eurozone, and the United Kingdom, 1970-2013", International Productivity Monitor, Centre for the Study of Pving Standards, Fall 2014, Spring 2015.
For a very useful discussion of these issues, see L. Rennison, F. Novin and M. Verstraete, "Firm Strategy, Competitiveness and Productivity: The Case of Canada", Bank of Canada Review, Autumn 2014, pp. 34-46.
The content of this article is intended to provide a general guide to the subject matter. Specialist advice should be sought about your specific circumstances.