

Governments are currently busy, or will be soon, preparing annual budgets that will be tabled in the months to come. The fiscal health and prospects of the provinces and federal government vary significantly. Whatever political, economic and social objectives they wish to pursue, in setting their budgets, ministers of finance are constrained by the tax, expenditure and public debt obligations that have been previously established and the always uncertain economic developments which will determine future revenue growth and expenditure obligations. They must set their own priorities for the coming years in the face of uncertain revenue prospects and existing financial constraints on the actions they can take.
The purpose of this paper is to outline the constraints that the provinces and the federal government face in the choices they can make in setting their budgets. Our purpose is not to recommend to ministers of finance particular fiscal actions they should take, but rather to provide an analysis of where government finances stand at present, how they got there, what the constraints are on the ability of governments to take actions in the years ahead, and what the fiscal prospects to 2022-23 are likely to be. Based on this analysis, we provide an overview of the key fiscal issues facing the largest jurisdictions in the country, namely Québec, Ontario, Alberta, British Columbia, and Canada. In a final section, we analyze the impact on economic performance that the status quo budget projections are likely to have over the next five years, i.e., is fiscal policy likely to be stimulating growth or restraining it?
I. Government Finances In 2017-2018
Over most of the last seven years, the federal and provincial governments have focused their effort on fiscal consolidation in the context of a protracted cyclical recovery following the severe recession of 2008-09. This downturn had given rise to a sharp expansion of net borrowing as a result of both automatic stabilizers and very substantial discretionary fiscal stimuli introduced in 2009 and 2010. As a result of the huge increase in borrowing between 2007 and 2010, the combined net debt of federal and provincial governments had risen from 53% of GDP in 2007-08 to 64% at the end of fiscal year 2010-11. Like governments in many advanced economies, Canadian provincial and federal governments started to move quickly in 2011-12 to reduce net borrowing. This restrictive fiscal policy continued in most provinces until fiscal year 2014-15 and for the federal government to fiscal year 2015-16. Since then the combined economic impact of federal and provincial fiscal policy has been modestly expansionary, especially in 2016, but even in 2018 when at the top of the business cycle it should have been at least neutral or mildly contractionary.
As at 2017-18, Québec and Ontario had ratios of net debt to GDP around 40%. This high debt level by sub-national governments constrains their ability to borrow without a significant increase in the interest rate premium they must pay. Thus, their ability to run an increasing deficit to stimulate their economies in the event of a major slowdown is constrained. Alberta and British Columbia with low debt ratios of less than 15% of GDP would face no immediate constraint in this regard (Table 1). The federal government with a net debt-to-GDP ratio of just over 35%1 would face only a mild constraint in running a more stimulative policy for a short period if a marked economic slowdown were to materialize.
At the peak of the economic cycle in 2017-18, governments in Canada, with the notable exception of Québec, ended up with their expenses exceeding total revenues. This was particularly the case for Alberta and the federal government. For Alberta the ratio of revenues to expenses dropped after 2014-15 as resource revenues plummeted along with oil prices while program spending on average kept growing at a solid pace. For the federal government, the rather low level of revenues to expenses in 2017-18 reflects three years of very strong growth in program spending and two years of moderate growth in total revenue, partly reflecting an increased emphasis of the government on income redistribution and economic stimulation. In Ontario, the ratio of revenues to expenses in 2017-18, at 0.98, is deceptively high in view of important changes in budget accounting and policy initiatives introduced in the fall of 2018, which are expected to durably lower the ratio to 0.91 starting in 2018-19. In 2018-19, program spending is expected to continue to increase rapidly in Ontario while growth in own-source revenue is expected to contract after a surge in 2017-18.
The relative levels of per capita revenues and expenditures across provinces as at 2017-18 (Table 1) are the cumulative results of the choices made by their governments in the past regarding the growth and structure of their revenues and expenses. Ontario and British Columbia have the lowest levels of program spending per capita among the provinces in 2017-18, as well as the lowest levels of total revenue per capita. This is not new—the same pattern existed in 2010 for both provinces—and appears to reflect a similar collective choice of low revenue take for low per capita spending levels. Yet in 2017-18, Ontario ended up with a much higher debt ratio than in 2010-11, while B.C. experienced a slightly lower ratio because the excess of expenditures (including capital investments) over revenues in these seven years was much greater for Ontario than for B.C. In contrast, Québec has elected to have relatively high levels of both program spending and own-source revenues on a per capita basis. Its debt ratio in 2017-18 was the second-highest among the provinces because for a long time its revenues did not keep pace with its total spending. Yet it currently has the highest ratio of revenues to expenses among all governments as a result of years of fiscal consolidation in this decade so that the trajectory of its debt-to-GDP ratio is downward.
In contrast to Québec, Alberta has a low debt-to-GDP ratio because generally strong , if volatile, resource revenues prior to 2015 were able to pay for high spending levels and, in fact, sustain a positive net financial asset position from 2000-2015. However, today Alberta is a huge net borrower with the second highest level of per capita spending and a relatively low level of revenues.
The trajectory of the debt-to-GDP ratio is sharply upward. To avoid a higher interest rate risk premium in the not too distant future, the budget choices of the Alberta minister of finance are constrained by the need to reduce expenditures on programs and capital and/or raise more tax revenues over the next several years.
Table 1: Government Expenditures and Revenues: 2017–18
| Program Spending | Public Debt Charges | Own-Source Revenue | Federal Transfers | Ratio (total revenues/total expenses) | Net Debt/GDP (%) | |
| ($ per capita) | ||||||
| Newfoundland | 13,602.30 | 1,886.79 | 11,527.44 | 2,239.41 | 0.89 | 44.4 |
| PEI | 11,663.27 | 818.36 | 7,833.22 | 4,656.52 | 1.0 | 33.2 |
| Nova Scotia | 10,458.23 |
864.55 | 7,334.34 | 3,757.90 | 0.98 | 35.0 |
| New Brunswick | 11,328.04 | 877.50 | 8,029.83 | 4,263.91 | 1.01 | 38.6 |
| Québec | 11,228.09 | 1,100.78 | 10,211.78 | 2,664.63 | 1.04 | 42.3 |
| Ontario | 10,080.24 | 838.68 | 8,858.68 | 1,751.52 | 0.98 | 39.2 |
| Manitoba | 11,910.84 | 711.45 | 8,964.14 | 3,138.76 | 0.96 | 34.3 |
| Saskatchewan | 11,823.32 | 481.43 | 9,955.43 | 2,079.39 | 0.98 | 14.2 |
| Alberta | 12,574.97 | 331.30 | 9,259.63 | 1,774.56 | 0.85 | 5.8 |
| British Columbia | 10,191.90 | 544.51 | 8,919.16 | 1,879.74 | 1.01 | 14.8 |
| Provincial W. Average | 10,811.05 | 798.51 | 9,210.01 | 2,158.22 | 0.98 | 30.2 |
| Federal Government | 8,463.48 | 596.30 | 8,543.24 | 0.94 | 35.5 | |
Source: Department of Finance (Canada), Fiscal Reference Tables, 2018, October 2018 and Statistics Canada, table 17-110-0005-01.
Note: Net debt represents the debt that has funded current
expenditures and capital investments, and increases from year to
year by the total amount of budget deficit and net capital
investments. There are other measures of debt, but net debt is the
only measure highlighted in most provincial budgets, and for this
reason, it is the one used in this report. In its fiscal update,
the federal government refers only to debt measured by the
accumulated deficit, which as a ratio to GDP, was 31.4% in
2017-18.
II. How Did We Get There?
On average, own-source revenues for the provinces and the federal government increased at essentially the same pace as Canadian nominal GDP from 2011 to 2017. However, there was considerable variation across provinces in the rate of growth of own-source revenues (Table 2). In this regard, resource-producing provinces were clearly disadvantaged by substantially lower commodity prices in 2015-17 than at the beginning of the decade. Federal transfers to the provinces, on average, grew more slowly than own-source revenues, although here again there was huge dispersion with transfers to Alberta growing fastest and those to Newfoundland, declining.
Table 2: Government Expenditures and Revenues (2017–18/2010–11)
| Program Spending | Public Debt Charges | Own-Source Revenue | Federal Transfers | Average Annual Growth | Change in Net Debt as % of GDP | |
| (Average annual growth %) | Total Revenues (%) Minus Total Expenses (%) | (p.p) | ||||
| Newfoundland | 1.0 | 2.5 | -0.6 | -5.5 | -2.8 | 16 |
| PEI | 2.5 | 2.1 | 4.2 | 1.4 | 0.6 | 0.5 |
| Nova Scotia | 3.4 | -0.4 | 3.0 | 1.8 | -0.5 | 0.0 |
| New Brunswick | 1.9 | 0.5 | 4.1 | 1.4 | 1.3 | 6.8 |
| Québec | 3.1 | 0.5 | 3.9 | 3.6 | 1.1 | -6.6 |
| Ontario | 2.8 | 2.5 | 4.8 | 0.9 | 1.4 | 5.2 |
| Manitoba | 3.6 | 3.0 | 4.2 | 0.5 | -0.4 | 10.7 |
| Saskatchewan | 1.3 | -3.3 | 0.5 | 2.0 | -0.3 | 8.2 |
| Alberta | 4.1 | 17.0 | 2.4 | 4.9 | -1.5 | 13.8 |
| British Columbia | 3.5 | 2.2 | 4.0 | 1.8 | 0.2 | -0.8 |
| Provincial W. Average | 3.0 | 5.0 | 3.8 | 2.0 | 0.5 | 3.8 |
| Federal Government | 3.3 | -3.8 | 3.8 | 1.1 | -2.0 | |
Source: Department of Finance (Canada), Fiscal Reference Tables, 2018, October 2018.
Efforts at fiscal consolidation rested on trying to control program spending. On average, the provinces and the federal government limited growth in programs to just a little more than the pace of inflation and population growth and, in fact, to significantly less than growth in their own-source revenues. Spending on health was somewhat restrained in all provinces but especially in Atlantic Canada and Ontario where, in real terms, that spending grew at lower rates than population growth (Table 3). Yet, demand for health care services no doubt grew faster than population because older age groups were gaining importance in the total population and these are the age groups for which per capita health care spending are the highest by far.
For the federal government, restraint applied to direct program expenses. Helping the federal government to limit expenditures relative to revenue was an expansion in EI premiums relative to payments and a substantial decline in interest payments on its debt, due to both a decline in its debt-to-GDP ratio and low interest rates. Despite a long period of ultra-low interest rates, provincial governments as a whole saw their public debt charges increase significantly, owing to rises in their debt-to-GDP ratio.
Table 3: Provincial Government Health Spending
| Per Capita ($) | Health/Program | Annual Growth (%) | |
| 2016–2017 | 2011–12 to 2016–17 | ||
| Newfoundland | 5,270.21 | 0.38 | 1.9 |
| PEI | 4,469.57 | 0.39 | 2.4 |
| Nova Scotia | 4,483.52 | 0.46 | 1.6 |
| New Brunswick | 4,243.97 | 0.39 | 1.3 |
| Québec | 3,957.29 | 0.37 | 3.7 |
| Ontario | 3,869.10 | 0.41 | 2.1 |
| Manitoba | 4,669.95 | 0.40 | 3.3 |
| Saskatchewan | 4,738.5 | 0.38 | 3.8 |
| Alberta | 4,946.84 | 0.40 | 3.7 |
| British Columbia | 4,101.56 | 0.42 | 3.4 |
| Provincial W. Average | 4,153.52 | 0.40 | 2.9 |
Source: Canadian Institute for Health Information, National Expenditures Trends, 1975 to 2018: Data Tables, Table F.3, November 20, 2018, Department of Finance (Canada), Fiscal Reference Tables, 2018, October 2018 and Statistics Canada, table 17-110-0005-01.
Overall, total revenues increased considerably faster than total expenditures for Ontario, Québec and the federal government between 2010 and 2017, resulting in a sharp reduction in their budget deficits. In contrast, oil producing provinces experienced a marked shortfall in the growth of total revenues relative to total expenses and their budget balances deteriorated markedly as a result. With the notable exception of Québec, provincial governments saw their debt-to-GDP ratio rise significantly, not only in oil producing provinces but also in provinces like Ontario, which cut its deficit substantially. The rise in net debt ratios reflects the fact that the accumulation of budget deficits and net non-financial (capital) investments (largely infrastructure) exceeded increases in GDP levels. Net debt would tend to accumulate faster relative to own GDP for provinces than for the federal government because the capital investment component of borrowing is larger relative to own GDP for provinces than it is for the federal government. This is not surprising given that provinces have the prime responsibility for building infrastructure in a host of sectors including health, education and highways.
III. Economic Constraints on Government Actions
In this section we discuss the economic and financial constraints on the ability of governments in Ottawa and the four largest provinces to take actions on the fiscal side in the years ahead, and more specifically constraints on running deficits, on raising own-source revenues and on restraining program spending.
1. Debt and Deficits
Governments have to pay attention to the level and trajectory of their debt relative to GDP in planning revenue measures, borrowing, program expenditures and budget balances. This is especially important now as Canada is at the top of the economic cycle, and there is a high likelihood of slowing economic growth over the next two years.
Québec and Ontario have similarly high debt ratios and are more vulnerable than the federal government and other provinces to a significant worsening of their budget balances. The fiscal dynamics, however, are far more worrisome for Ontario than for Québec. Ontario's budget deficit has increased substantially in 2018-19 and is projected to remain very significant in the years ahead, unless restrictive actions are taken, whereas Québec's budget balance has been in surplus for several years and is projected to continue to be in surplus in the next four years. Thus, whereas Ontario's debt ratio is expected to rise appreciably in the years ahead in the absence of fiscal retrenchment, Quebec's debt ratio is expected to decline going forward in the absence of new fiscal initiatives. Ontario has little choice but to start reining in its budget deficit without delay, knowing that the economic environment will be less favorable than in recent years.
Fiscal dynamics have continued to be highly unfavoyrable in Alberta in 2018-19 as the province registered another considerable deficit as a result of continued low resource revenues. Even though the gap between per capita revenues and expenditures is larger in Alberta than Ontario, because Alberta's debt-to-GDP ratio is lower, the need for urgent action in budget 2019 is not as great. B.C., with a low debt-to-GDP ratio and small budget surplus, is the least fiscally constrained of the four largest provinces.
2. Own-Source Revenues
The structure of own-source revenue is far from uniform across governments (Table 4). Notably, oil-producing Saskatchewan and Alberta rely more than the others on resource royalties (part of "other own-source revenues" in Table 4), and much less on taxes on products (Alberta) or income (Saskatchewan). Ontario, on the other hand, relies more heavily than the other large provinces on taxes on income and relatively little on "other own-source revenues". Québec and B.C. draw their revenues more equally across the three categories of revenue.
Over 2011-2017, provinces relied far more heavily than the federal government on sources of revenue that are not as sensitive to economic growth and hence tend to grow more slowly (Table 4). The overall receipts from sources other than the taxes on income and on products have indeed been a very significant source of revenue for provinces, with the major exception of Ontario, but they have tended to increase at significantly lower rates than the taxes on income and products, except in Québec. Thus, on average in 2017 provinces obtained 27% of their own-source revenues from "other own-source revenues", which grew at only 2.3% per annum from 2011 to 2017 compared with growth rates of 4.8% for the provincial taxes on income and on products. By contrast, the federal government obtained 68% of its revenue from income taxes, which grew at 5% per annum. An actual decline in the level of oil and gas royalties exerted a major drag on the growth of "other own-source revenues" for provinces between 2010 and 2017.
Table 4: General Government Own-Source Revenue: 2011–2017
| Taxes on Income |
Taxes on Products |
Other Own-Source Revenues | |||||||
| 2017 $ per capita |
Share of 2017 Revenue | Average Growth 2011-17 (%) | 2017 (% per capita) |
Share of 2017 Revenue (%) | Average Growth 2011-17 (%) |
2017 (% per capita) |
Share of 2017 Revenue (%) | Average Growth 2011-17 (%) |
|
| Newfoundland | 3353 | 33 | 5.8 | 4253 | 41 | 5.7 | 2700 | 26 | -6.4 |
| PEI | 2980 | 38 | 6.3 | 3065 | 39 | 3.1 | 1783 | 23 | 0.9 |
| Nova Scotia | 3468 | 44 | 3.7 | 3113 | 39 | 2.1 | 1383 | 17 | 1.5 |
| New Brunswick | 2712 | 33 | 4.3 | 3209 | 39 | 4.1 | 2384 | 29 | 2.5 |
| Québec | 4367 | 39 | 3.6 | 3335 | 30 | 5.4 | 3589 | 32 | 4.4 |
| Ontario | 3597 | 44 | 538 | 3121 | 38 | 4.9 | 1485 | 18 | 3.7 |
| Manitoba | 3078 | 36 | 4.6 | 3134 | 37 | 4.6 | 2350 | 27 | 3.7 |
| Saskatchewan | 2640 | 26 | -0.8 | 3999 | 40 | 3.9 | 3352 | 34 | -3.6 |
| Alberta | 311 | 38 | 3.8 | 1789 | 20 | 6.1 | 3708 | 42 | -0.9 |
| British Columbia | 3283 | 37 | 6.8 | 2964 | 34 | 3.4 | 2597 | 29 | 3.9 |
| Provincial W. Average | 3621 | 40 | 4.8 | 3039 | 33 | 4.7 | 2500 | 27 | 2.3 |
| Federal Government | 5684 | 68 | 5.0 | 1567 | 19 | 3.3 | 1125 | 13 | 2.2 |
Source: Statistics Canada, tables 10-10-0017-01, 36-10-0477-01 and 17-110-0005-01.
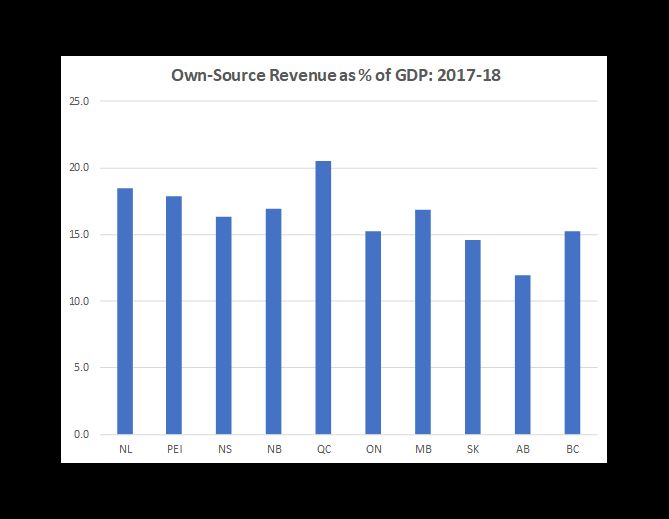
Large variations in the ratio of own-source revenues to nominal GDP suggest that the capacity to raise more revenue through new or higher taxes and fees, irrespective of their effect on income redistribution or economic efficiency, differs significantly across the provinces (Chart 1). Provinces with relatively low GDP per capita (Québec, Manitoba, Atlantic provinces) already raise a greater percent of provincial GDP through their own-source revenue systems than do the richer provinces. Because of that, the need to remain economically competitive domestically and internationally, limits their ability to raise income tax rates and other taxes, fees and charges. Alberta, on the other hand, has considerable room to do so while remaining tax competitive, both domestically and internationally.
Chart 1:
Sources: Department of Finance (Canada), Fiscal Reference Tables, 2018, October 2018 and Statistics Canada table 36-10-0222-01.
Québec, with high marginal personal income tax rates and an elevated general sales tax rate (9.98%), is constrained in raising these taxes if it is to remain domestically competitive in attracting business investment and skilled professional workers. On the other hand, it has considerable economic room (but not necessarily political room) to permit Hydro Québec to raise household electricity rates to levels closer to those prevailing in adjacent markets and thereby increase the dividends paid to the government. Québec also has economic room to raise fees and charges for provincial services such as university tuition fees, daycare for young children, and bridge and road tolls, however politically difficult this may be.
Like Québec, Ontario is constrained by the need to remain internationally tax competitive, which gives it little room to maneuver by raising marginal rates of personal or corporate income tax, Ontario's most important revenue source. While there is some economic room to raise taxes on products (HST, beer, gasoline, etc.) the current government has rejected that approach. Thus, Ontario may have to look to other sources of revenues (tolls, tuition fees, user charges, etc.) to raise revenues. The constraints on raising these sorts of revenue are largely political, not economic. Unfortunately, Ontario is limited by lack of natural resource production from which to extract royalty revenue.
Unlike Ontario and Québec, Alberta has some economic room to maneuver on both taxes and user charges in order to plug the revenue loss from falling resource receipts. Alberta has personal and corporate income tax rates below other provinces and is the only province without a general sales tax while the (unweighted) average of other provinces is 8.8%. Receipts from contributions to social security and workman's compensation are also relatively low. Unfortunately, Alberta has little discretionary room to raise more revenue from royalties as long as oil prices remain low, except by stimulating production.
British Columbia is in the most enviable fiscal position of the four large provinces with projected future budget surpluses and fewer economic constraints on its ability to generate revenue increases through small increases in both income and sales tax rates.
The federal government, with high marginal rates of personal income tax, has little economic room to maneuver to increase tax rates to supplement its dominant source of revenue. International competitiveness also limits the ability to raise additional corporate income tax revenue. A small increase in the federal GST rate may be the least economically damaging way to raise additional federal revenues, however politically unpopular this may be.
3. Program Spending
In this section, we first examine what might be the reason high program spending per capita in some provinces and low program spending per capita in others. We briefly discuss the potential constraints to cutting program spending which may arise from the need to maintain minimum standards of public services, account taken of varying demographic demand for these services across provinces. We conclude with comments on the impact that various measures to cut program spending might have on the quantity and quality of public services.
Program spending refers to government direct expenses, subsidies and transfers that support services in the field of health, education, social assistance, justice, transportation, arts and culture, economic development, etc. Program spending reflects the quantity and quality of the services that the government provides, how large the compensation is that the government pays per employee or hour worked, how high the productivity of these employees is, and how much the government must disburse per unit of the services that it produces or supports to acquire the services of capital, to pay for the purchases of goods and services, and to provide subsidies and transfers.
Because there are no market prices for government services, it is not possible to measure differences in the actual value (quantity and quality) of public services provided by the provinces. All we can do is to examine differences in underlying program spending per capita and make some inferences from available data about the reasons for these differences. First, if there were economies of scale in the supply of public services they might show up in lower unit costs for these services in large provinces than in small ones, and hence in lower program spending per capita in large provinces. This was indeed the case both in 2010 and 2017, with program spending per capita in large provinces lower than in smaller provinces by nearly10% in each year.
Second, we have data on labour compensation per hour in government services and consequently we can check whether they help explain why program spending per capita is high in some provinces and low in others. Labour compensation is not a trivial expense: it accounts for a considerable percentage of the total cost of provincial government services in terms of labour, capital and intermediate inputs of goods and services. In health and social assistance, for instance, compensation accounted for 50% of total costs in 2014 and in education (excluding universities) for 44%3.
In Ontario in 2017, labour compensation per hour in government educational services, government health services and other provincial government services was modestly higher than the Canadian average (Chart 2). It was also the case in Alberta with respect to health services and, to a lesser extent, "other provincial government services", and in B.C. with respect to "other provincial government services". On the other hand, in Québec labour compensation per hour in the three services was lower than the Canadian average, especially with respect to health services.
Thus, one could not ascribe low program spending per capita in Ontario to low compensation per hour in providing government services. The source of low spending per capita must be found elsewhere: perhaps the Ontario government offers less services per capita or of lower quality than average; or the government is relatively efficient in supplying these services, possibly taking advantage of economies of scale; or the government incurs relatively low unit costs for the goods and services that it purchases. Subsidies and social benefits per capita in Ontario were close to the provincial average in 2017 and could not account for low program spending per capita in the province.
Chart 2:

Source: Statistics Canada, table 36-10-0480-01.
For Alberta, it is worth noting that the recent high level of program spending per capita relative to the Canadian average reflects, at least in part, relatively high labour compensation per hour in the public sector, notably in health services.
Even if labour compensation per hour in the Québec public sector is lower than the Canadian average, program spending per capita is significantly higher, presumably reflecting higher output of services per capita or lower efficiency in delivering services, or higher unit costs for the goods and services that the government purchase. It is worth noting that in Québec per capita transfers for social security and social assistance are much larger than in the three other large provinces and higher than in virtually every other province. This likely contributes to higher government output per capita in Québec.
In judging the extent to which growth in program spending can be cut without significantly reducing key services, it is important to take account of some important determinants of the demand for public services. Obviously, total population is one of them and although it grows at about 1.2% a year on average in Canada, the dispersion of growth rates across provinces is enormous (Chart 3). Thus, demand for services to accommodate total population would grow slowly in Atlantic Canada and to a lesser extent Québec, and relatively rapidly in Western Canada and Ontario.
Chart 3:

Source: Statistics Canada, table 17-10-0005-01.
The age structure of population is another determinant of the demand for services. In the provinces where older age groups are particularly important in the total population, as in Nova Scotia and New Brunswick, the demand for health and social assistance services would be higher than in the Prairies where these groups are considerably less important. Québec, Ontario and B.C. would be intermediate cases in this respect. Thus, the age structure of population may explain in part why government health expenditures per capita are relatively high in the Atlantic provinces (see Table 3). In the same vein, one would expect a higher than average demand for education services in provinces where persons of school age constitute a larger proportion of the total population than average. Thus, demography would create a greater demand for educational services in the Prairies than in the rest of the country.
In provinces where population growth and population aging are projected to be rapid in the next four years the demand for health, social assistance and education services should grow at a relatively high rate. Consequently, cutting growth in program spending in these provinces risks creating a growing shortage of supply relative to demand for them. This would be the case in Western Canada and Ontario.
We conclude this section by calling attention to the impact that various measures to cut program spending might have on the quantity and quality of public services. The only safe way for governments to cut program spending without reducing the quantity and quality of government services is to raise the productivity of employees, capital and purchased goods and services, and/or to pay lower prices for the same quality of purchased goods and services, and/or to make subsidies and transfers more effective in achieving their objectives. In their efforts to raise productivity, governments focus on cutting waste or inefficiencies in their operations through leaner, more efficient organization of responsibilities and tasks, for example, or through consolidating the supply of services and thereby taking advantage of economies of scale. Waste and inefficiencies can, and should, always be reduced. But, there is a limit to which improved management or technology can do this. In the end, efforts in this direction often reduce real services for some groups of people. Cutting subsidies and transfers without decreasing taxes at the same time in all likelihood reduces current welfare inasmuch as subsidies and transfers support household consumption or business investment4. Restraining labour compensation per hour may result in a less skilled workforce thereby lowering the quality of public services provided. Reducing employment, hours worked or purchased goods and services may boost productivity but not necessarily by enough to prevent a decline in the quantity of services produced.
It would seem appropriate that, prior to undertaking important cuts in program spending, a government "considers the purpose of each and every public service; whether those services are fulfilling their objectives, and at reasonable cost; and whether there are better alternatives on offer.5"
III. Fiscal Prospects and Key Issues
In this section we examine fiscal prospects to 2022-23 for the governments of Canada, Ontario, Québec, Alberta and B.C., based on the fiscal updates put out by the federal and Québec governments this fall and on projections we make for Ontario, Alberta and B.C. In the case of Ontario, we make one status quo projection based only on the fiscal initiatives announced in last fall's economic and fiscal statement and another one that is set to achieve the announced objective of a balanced budget in five years through program spending. For all five governments we project net capital investments based on existing plans6. Combining the projections of net capital investments and budget deficits, we obtain profiles for net borrowing and the net debt-to-GDP ratio going forward. In light of their budget prospects and the potential fiscal constraints we identified above, we conclude our analysis for each large province and the federal government by presenting what, in our view, are the key fiscal issues facing each one of them.
Economic Outlook
When the federal and Québec updates were put out in the fall of 2018, the consensus view of economists was that the global and Canadian economies would slow down to their potential rates in the short term and more or less grow at those rates thereafter. Canadian economic growth has projected to moderate from 2% in 2019 to 1.8% in 2020 and 1.7% in subsequent years. U.S. and Canadian interest rates would rise moderately in 2019 and little afterwards. Oil prices might fluctuate a lot but would average somewhere between the mid-$50s and the low $60s on an annual average basis. Likewise, the Canadian dollar was expected to average mostly between 75 and 80 US cents in the years ahead. This "ultra-soft-landing" scenario, underlying spring budgets and fall statements is still our base-case scenario. But risks are now viewed as being greater and many forecasters have marked down growth forecasts, lowered expected oil prices and Canadian dollar, and reduced projected bond yields.
In the analysis which follows, we do not revise our base-case fiscal projections to 2022 on updated global and Canadian macroeconomic scenarios, as this might prove premature in any case. What we want to do is to describe two scenarios of how the Canadian fiscal situation may evolve in the years ahead: a first scenario in which large macroeconomic shocks are avoided as in the base-case scenarios prevailing last fall, and a second scenario in which the Canadian and provincial economies experience a marked slowdown in 2020-21. We do not attempt to provide a detailed, specific slowdown scenario for each of the four provinces and Canada which would derive from a well-worked out particular scenario for the global economy. Instead, each jurisdiction is assumed to experience a temporary shock to growth of the same magnitude and duration as the others, and interest rates are assumed to temporarily decline as a result. Our aim is to expose the risks that a shock to growth entails for the pursuit of fiscal objectives.
Federal Government
In its Fiscal Update last fall, the federal government projected its total revenues from 2018-19 to 2022-23 to grow on average at a rate slightly faster than nominal GDP and its program expenses to expand at a rate close to population growth plus inflation (Table 5). As a result, the federal government projected a considerable shrinkage of its budget deficit over the years, except in 2019-20 due to a decline in corporate income taxes, reflecting measures proposed in the Fall Update to stimulate investment, and to a jump in public debt charges resulting in part from a larger increase in interest rates in that year. Taking account of previously projected capital investments, we estimate that the net debt-to-GDP ratio would steadily decline from 35% in 2018-19 to 33.2% in 2022-23. In terms of accumulated deficit, and as reported in the update, the federal debt would fall from 30.9% to 29.2% over the same period. Net borrowing would increase markedly in 2019-20 due to increases in both the budget deficit and net capital investments and subsequently diminish, implying a positive fiscal impulse to growth in 2019 followed by negative impulses in later years.
Table 5: Federal Government: Fall 2018 Update—Base Case
| 2017-18 | 2018-19 | 2019-20 | 2020-21 | 2021-22 | 2022-23 | |
| Total Revenues (% changes) | 6.9 | 4.9 | 3.1 | 3.8 | 4.5 | 3.9 |
| Program Expenses (% changes) | 6.7 | 3.1 | 2.5 | 2.7 | 3.2 | 3.1 |
| Public Debt Charges ($ millions) | 21,889 | 23,800 | 27,500 | 29,.900 | 31,800 | 32,700 |
| Budget Deficit ($ millions) | -18,961 | -18,100 | -19,600 | -18,100 | -15,100 | -12,600 |
| Net Capital Investments ($ millions) | 2,700 | 2,900 | 3,200 | 2,800 | 3,600 | 3,600 |
| Net Debt-to-GDP Ratio (%) | 35.5 | 35.0 | 34.6 | 34.4 | 33.9 | 33.2 |
| Accumulated Deficit to GDP (%) | 31.4 | 30.9 | 30.5 | 30.3 | 29.8 | 29.2 |
| Nominal GDP (% changes) | 5.6 | 4.2 | 4.1 | 3.3 | 3.7 | 4.0 |
A temporary negative shock to nominal GDP growth of two percentage points in 2020-21 permanently cuts total revenues by 2.2% (Table 6). Assuming no additional discretionary spending, it also leads to a marked increase in total expenses in 2020-21, due to automatic stabilizers (notably EI) and to increases in the next two years, due to increased public debt charges, the latter responding to higher debt levels slightly offset by lower interest rates on the debt. Budget deficits are considerably larger than in the base case and even by 2022-23 the deficit is no smaller than in 2018-19. By 2022-23, the net debt-to-GDP ratio is 34.8% instead of 33.2%, and close to the 2018-19 ratio. Thus, even a temporary shock to growth can derail plans to improve government finances.
Table 6: Federal Government: Fall Update—Negative Shock to Growth in 2020-21
| 2019-20 | 2020-21 | 2021-22 | 2022-23 | |
| Effects on: | ||||
| Total Revenues (%) | 0.0 | -2.2 | -2.2 | -2.2 |
| Total Expenses (%) | 0.0 | 1.7 | 0.3 | 0.1 |
| New Levels: | ||||
| Budget Deficit ($ millions) | -19,600 | -29,045 | -21,440 | -18,193 |
| Net Debt-to-GDP Ratio (%) | 34.6 | 35.5 | 35.3 | 34.8 |
| Accumulated Deficit to GDP (%) | 30.5 | 31.4 | 31.1 | 30.6 |
| Nominal GDP (p.p.) | 4.1 | 1.3 | 3.7 | 4.0 |
The federal government has had a rather low level of total revenues to total expenses in 2017-18 at the peak of the economic cycle, after three years of very strong growth in program expenses and two years of moderate growth in total revenue, partly reflecting an increased emphasis of the government on income redistribution and economic stimulation. The big negative side of this strategy is that the government has left itself less room to stimulate the economy via discretionary measures in the event of a future major recession than it would have had if it had run a balanced budget. In other words, given the higher debt ratio that it now has, the government has less financial room to put in place a stimulus package of sufficient size in the event of a major recession, knowing that its net debt could rise by as much as five percentage points of GDP, as it did in 2009-10. This being said, on the soft-landing scenario the federal government projects a considerable shrinkage of its budget deficit after 2019-20. Taking account of previously projected net capital investments7, the net debt-to-GDP ratio would steadily decline from 35% in 2018-19 to 33.2% in 2022-23. A temporary negative shock to growth of two percentage points in 2020-21 would cancel this improvement but still leave the debt ratio by 2022-23 below what it is in 2018-19, assuming the government takes no discretionary action.
In the event of the negative shock described above, the fiscal plan set out in the fall economic statement has left the federal government enough room to allow the automatic tax and expenditures to work without increasing the net debt-to-GDP above 35% by 2022-23. However, the debt ratio would rise substantially more in the event of a major recession, both because the action of automatic stabilizers would be amplified and because the government would have to provide a substantial stimulus package. Moreover, in the event of a major recession, the burden of stabilizing the Canadian economy will fall almost entirely on the federal government as Ontario, the largest province, will be in no financial position to provide discretionary stimulus or perhaps even to let its own automatic stabilizing policies continue to work.
In his spring budget, the federal minister of finance should take no spending or tax actions which would further compromise a future government's room to take the necessary discretionary action to support growth and public investment in the event of a major economic downturn, unless these actions are aimed directly and demonstrably at enhancing productivity and investment to promote the potential growth of the economy.
Québec
In its fall Update, the government of Québec projected continued, moderate budget surpluses from 2018-19 to 2022-23 and a marked decline in its net debt-to-GDP ratio from 40.2% in 2018-19 to 35.3% in 2022-23 (Table 7). On average, program expenses increase by 3% per annum from 2019-20 to 2022-23, about the pace of inflation plus population growth. Own-source revenues grow at only 2.9% per annum over the same period, mostly reflecting conservative assumptions about nominal GDP growth and the negative impacts on corporate income taxes of measures to ease tax burdens and stimulate investment. Projected growth in federal transfers is modest after 2019-20, in fact, far smaller than the growth rates projected by the federal government for total transfers to other governments.
Table 7: Québec Government: Fall 2018 Update—Base Case
| 2017-18 | 2018-19 | 2019-20 | 2020-21 | 2021-22 | 2022-23 | |
| Total Revenues (% changes) | 5.3 | 3.8 | 2.2 | 2.8 | 2.7 | 3.3 |
| Program Expenses (% changes) | 5.9 | 4.9 | 4.4 | 2.6 | 2.4 | 2.9 |
| Public Debt Charges ($ millions) | 9,240 | 9,132 | 9,221 | 9,495 | 9,673 | 9,981 |
| Budget Surplus ($ millions) | 4,915 | 4,501 | 2,499 | 2,837 | 3,353 | 3,895 |
| Net Capital Investments ($ millions) | 2,173 | 3,186 | 3,131 | 2,992 | 2,772 | 2,437 |
| Net Debt-to-GDP Ratio (%) | 42.3 | 40.2 | 39.0 | 37.8 | 36.6 | 35.3 |
| Nominal GDP (% changes) | 5.0 | 4.4 | 3.5 | 3.2 | 3.0 | 3.0 |
A temporary negative shock to nominal GDP growth of two percentage points in 2020-21 permanently cuts total revenues by 1.6% on the assumption that federal transfers remain the same (Table 8). It also leads to a small initial increase in total expenses, due to the modest effects of stabilizers and to increased public debt charges in response to higher debt levels. Slightly lower interest rates than otherwise on the debt tend to lower total expenses. The budget surpluses are significantly smaller than in the base case. By 2022-23 the net debt-to-GDP ratio is 37.5% instead of 35.3%, but still lower than in 2018-19. Overall, this crude analysis suggests that Québec finances would be fairly resilient to a temporary negative shock to growth.
Table 8: Québec Government: Fall Update—Negative Shock to Growth in 2020-21
| 2019-20 | 2020-21 | 2021-22 | 2022-23 | |
| Effects on: | ||||
| Total Revenues (%) | 0.0 | -1.6 | -1.6 | -1.6 |
| Total Expenses (%) | 0.0 | 0.2 | 0.1 | -0.2 |
| New Levels: | ||||
| Budget Surplus ($ millions) | 2,499 | 799 | 1,455 | 2,289 |
| Net Debt-to-GDP Ratio (%) | 34.6 | 35.5 | 35.3 | 34.8 |
| Nominal GDP (p.p.) | 3.5 | 1.2 | 3.0 | 3.0 |
The Québec government had a healthy ratio of total revenues to total expenses in 2017-18, and therefore, has room to lower tax rates and/or continue to increase program spending at a robust pace in the short term following a strong increase in 2017-18. On the basis of its own projections of total revenue growth, the province would register continued significant budget surpluses over the next four years and a marked decline in its net debt-to-GDP ratio. Moreover, Québec finances would be fairly resilient to a temporary negative shock to growth. Already high levels of tax revenue per capita and net debt relative to GDP, however, put constraints on the speed of increases in program spending and capital investment in the longer run (Table 1). The objective of the government to reduce its debt ratio in the next several years, in accordance with the Act to reduce debt and establish the Generations Fund, works towards reducing these constraints, and is effectively embedded in the fiscal plan put out in the fall Update. One key challenge for Québec is to raise potential growth in the economy so as to generate stronger growth in own-source revenue without increasing marginal income tax rates for persons and businesses in key growth sectors.
Ontario
The 2018 Ontario Economic Outlook and Fiscal Review released last fall does not contain any fiscal projection beyond 2018-19. Nevertheless, the current government took policy decisions that are expected to reduce both revenues and program spending in 2018-19 and over the next four years, the cuts in revenues being somewhat larger on average than the ones in expenses ($3.4 billion vs $3.1 billion8). Moreover the government declared its intention to eliminate the budget deficit in five years through expense restraint alone.9
In a status quo scenario, own-source revenue grows at the rate of nominal GDP before subtracting the effect of the policy decisions already taken, federal transfers receipts grow at the same pace as the aggregate transfers to the provinces that the federal government projects in its Update, interest on the public debt increases gradually, and program spending grows at the rate of inflation plus population growth before subtracting the effect of the policy decisions already taken. Net capital investments are the same as implied by the spring 2018 budget in the short term and projected to decline gradually thereafter.
Ontario's budget deficit hovers around $14 billion through to 2022-23, even as program spending grows at only 2.7% per annum after 2018-19 (Table 9). The net debt-to-GDP ratio climbs to 43.4% in 2022-23 from 40.2% in 2018-19. Public debt charges increase at a much faster pace than nominal GDP as both the debt ratio and the interest rate on the debt rise. By 2022-23, these charges lay claims on 10% of total revenues and keep rising. Clearly, the province is on an unsustainable fiscal path under a status quo scenario. It will need to raise more revenues, and not just cut program spending, to materially lower its deficit.
Table 9: Ontario Government: Status Quo
| 2017-18 | 2018-19 | 2019-20 | 2020-21 | 2021-22 | 2022-23 | |
| Total Revenues (% changes) | 7.0 | -1.2 | 2.4 | 4.1 | 4.1 | 3.6 |
| Program Expenses (% changes) | 8.3 | 5.8 | 2.6 | 2.2 | 3.0 | 3.1 |
| Public Debt Charges ($ millions) | 11,903 | 12,542 | 13,457 | 14,534 | 15,561 | 17,264 |
| Budget Deficit ($ millions) | -3,672 | -14,375 | -15,599 | -13,833 | -13,067 | -13,760 |
| Net Capital Investments ($ millions) | 5,117 | 6,830 | 8,250 | 8,250 | 7,000 | 6,000 |
| Net Debt-to-GDP Ratio (%) | 39.2 | 40.2 | 41.4 | 42.4 | 42.9 | 43.4 |
| Nominal GDP (% changes) | 4.1 | 3.8 | 3.8 | 3.7 | 3.7 | 3.7 |
A temporary negative shock to nominal GDP growth of two percentage points in 2020-21 only makes the status quo more unsustainable. It permanently cuts total revenues by 2.0% on the assumption that federal transfers remain the same (Table 10). It also leads to a modest initial increase in total expenses due to the small effects of stabilizers and increased public debt charges in response to higher debt levels. Slightly lower interest rates than otherwise on the debt tend to lower total expenses, assuming no widening of credit spreads against Ontario. The budget deficits are significantly larger than in the base case and by 2022-23 the net debt-to-GDP ratio reaches 45.6%.
Table 10: Ontario Government: Status Quo + Negative Shock to Growth in 2021
| 2019-20 | 2020-21 | 2021-22 | 2022-23 | |
| Effects on: | ||||
| Total Revenues (%) | 0.0 | -2.0 | -2.0 | -2.0 |
| Total Expenses (%) | 0.0 | 0.3 | 0.2 | 0.0 |
| New Levels: | ||||
| Budget Deficit ($ millions) | -15,669 | -17,507 | -16,832 | -17,366 |
| Net Debt-to-GDP Ratio (%) | 41.7 | 43.8 | 44.8 | 45.6 |
| Nominal GDP (p.p.) | 3.8 | 1.7 | 3.7 | 3.7 |
In a zero-deficit scenario, the budget deficit is eliminated by 2022-23 only by keeping the growth rate of program spending close to zero over the next four years (Table 11). This drastic retrenchment is (conservatively) estimated to cut GDP growth by 0.4 percentage points, which in turn increasingly depresses the level of own-source revenue and tends to enlarge the deficit. Thus, a severe fiscal retrenchment exerts a negative feedback on government finances, which makes it harder to achieve the zero-deficit objective. In the specific case here, program spending could grow nearly 0.5% per annum faster from 2020-21 to 2022-23 in the absence of any negative feedback, and yet bring the deficit to zero by 2022-23.
Table 11: Ontario Government: Zero-Deficit Scenario
| 2017-18 | 2018-19 | 2019-20 | 2020-21 | 2021-22 | 2022-23 | |
| Total Revenues (% changes) | 7.0 | -1.2 | 2.1 | 3.8 | 3.8 | 3.3 |
| Program Expenses (% changes) | 8.3 | 5.8 | 0.5 | 0.2 | 0.2 | 0.2 |
| Public Debt Charges ($ millions) | 11,903 | 12,500 | 13,455 | 14,429 | 15,244 | 16,536 |
| Budget Deficit ($ millions) | -3,672 | -14,333 | -12,980 | -8,540 | -3,688 | 110 |
| Net Capital Investments ($ millions) | 5,117 | 6,830 | 8,250 | 8,250 | 7,000 | 6,000 |
| Net Debt-to-GDP Ratio (%) | 39.2 | 40.2 | 41.3 | 41.8 | 41.6 | 40.9 |
| Nominal GDP (% changes) | 4.1 | 3.8 | 3.4 | 3.3 | 3.3 | 3.3 |
Given prospects for only moderate growth in fiscal revenues in the years ahead as the economy has reached its cyclical peak, bringing the deficit to zero through program spending restraint alone and in only five years entails keeping the growth rate of nominal program spending close to zero in the next four years, which would imply a significant cut in the quality and quantity of public services and hence welfare. This clearly argues for both a substantial lengthening of the planned retrenchment period and raising more own-source revenue, including taxes on products. In the event of a negative shock to growth from external factors, a major recession cannot be excluded in the next four years. In this case, the problem would only get worse. We therefore think that the government would enhance its credibility and reduce the pain of fiscal retrenchment if it were to replace its zerodeficit objective by one of stabilizing the debt-to-GDP ratio and bringing it down gradually through actions on both program spending and own-source revenue.
Raising more own-source revenue is challenging. Own-source revenues, other than taxes on income and products in Ontario, are by far the lowest in Canada on a per capita basis (except in Nova Scotia), but the prospects for a significant boost to revenue from this source are limited by the lack of natural resources from which to extract royalties. This being said, increasing fees and charges for government services (road tolls, for example) could bring in non-negligible additional revenues while facilitating the maintenance and expansion of growth-enhancing infrastructure. Raising tax rates on income would likely have negative implications for potential growth. Increasing the HST rate would bring in significant additional revenues and the negative impact that this would have on low-income groups could be mitigated by increased tax credits.
Alberta
Budget projections for Alberta are particularly hazardous because of the difficulty of correctly anticipating the evolution of resource revenues, which importantly depend on volatile oil prices. Thus, the projected estimates below have a large confidence band around them and consequently must be taken as no more than indicative of what might happen going forward.
The Alberta government has released no update of its Budget 2018 projections except for 2018-19. In the status quo scenario below, program expenses increase at the pace of general inflation plus population growth, federal transfers receipts grow at the same rates as the aggregate transfers to the provinces that the federal government projects in its fall Update, and own-source revenue other than resource revenue rises at the same pace as nominal GDP. Resource revenue is assumed to plunge by 15% in 2019-20 as a result of a lower WTI oil price and subsequently rebound as transportation bottleneck diminishes, oil production increases, and WTI oil price recovers to about US$60 on average.
In this status quo scenario the budget deficit expands in 2019-20 and hovers around 2.2% of GDP thereafter (Table 12). The net debt-to-GDP ratio climbs from 8.9% in 2018-19 to 18.9% in 2022-23, even as net capital investments diminish over the period. Public debt charges more than double in the five years to 2022-23, by which time they account for over 7% of total revenues and keep rising. Thus, with oil prices likely to remain at modest levels in the forseable future, Alberta faces a chronic shortage of revenues to fund its expenses. Its net debt-to-GDP is low by provincial standards, even by 2022-23, but the fiscal dynamics are unsustainable at currently projected oil prices. The province will need to adjust both its program spending and its revenue structure to lower its budget deficit. More stable revenue growth, as the dependency on volatile resource royalties is diminished, would also be desirable.
Footnote
1 The federal debt-to-GDP ratio, whatever measure of debt is used, is relatively low by international standards for a national government. Also, the combined federal and provincial net debt as a share of GDP is not unusually high.
2 As indicated by national productivity accounts: see Statistics Canada table 36-10-0217-01. The year 2014 is the last one for which estimates are currently available.
3 While efforts to cut current spending reduce current welfare, they would also reduce future public debt charges and thus, enhance future welfare. But, future welfare gains are usually discounted far too highly by governments currently in power and by the general public.
4 Jean Tirole, "Macron's Great Gamble", Project Syndicate, January 21, 2019.
5 Net capital investment corresponds to non-financial investment less amortization of tangible assets, the latter being already included in program expenses and hence budget deficit. Thus, in estimating net borrowing and hence net debt, capital spending on a cash basis is fully taken into account but imputed capital consumption is not at all. Projections of net capital investments for Québec are to be found in its fall Update and for the other jurisdictions they are made on the basis of information taken from 2018 budgets and related publications. Ontario and British Columbia projections were extended to 2021-22 and 2022-23 by the authors.
6 As measured by changes in the non-financial assets projected in Budget 2018, table A2.6.
7 For more details on these policy decisions and their impact, see Financial Accountability Office of Ontario (FAO), Economic and Budget Outlook, Fall 2018. In this exercise we use their figures for the cuts in revenues and program spending that result from the policy decisions of the government.
8 According to the FAO, the "Fiscal Transparency and Accountability Act requires the government to provide a recovery plan in the annual Provincial Budget that specifies how the budget will be balanced, and the time over which it will do so." See Economic and Budget Outlook, Fall 2018, p.22.
To read the full article click here
The content of this article is intended to provide a general guide to the subject matter. Specialist advice should be sought about your specific circumstances.