

When exporting a product, it is advisable to have Intellectual Property (IP) related to that product in the market of destiny. In addition to providing rights to explore the asset (trademark or a design, for example) in exclusivity, having IP in the market where the goods are exported lowers the probability of facing customs obstacles. This is what several Chinese companies and individuals do every year in the European Union (EU), filing trademark (EUTM) and design (RCD) applications. How many is part of the object of this article1, as it focuses on the statistics of trademark and design applications by Chinese applicants. The sources used are the "Statistical travel pack by country/territory, 01/1996 to 09/2023 Evolution"2, the "EUIPO Statistics for Community Designs 2003-01 to 2023-09 Evolution"3, and "EUIPO Statistics for European Union Trade Marks 1996-01 to 2023-09 Evolution"4, all issued by the European Union Intellectual Property Office (EUIPO).
Total EUTM applications
The absolute number of EUTM applications filed by Chinese
companies and individuals from
January 1996 to September 2023, and the number of those that were
registered totals 170,493 (until September 2023). This
represents 6.16% of all EUTMs and makes China the sixth country
with more EUTM applications. However, if we only take the year 2023
into account, China is the country with more EUTM applications (17
793, against the 16 894 from Germany, in second place).
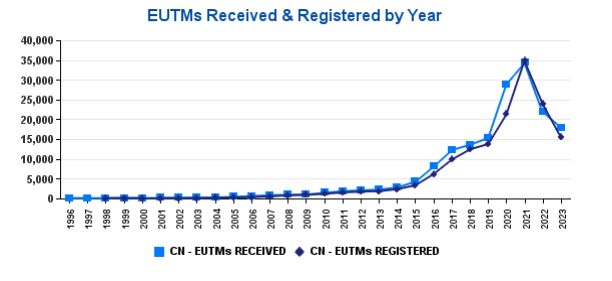
From 1996 to 2023 there was an accentuated growth of EUTMs applications filed by Chinese applicants and registered, having the 63 applications filed on 1996 become 17,792 in 2023 (until September). This means that in the last three decades, approximately, the number of Chinese EUTM applications by year grew 282 times. The growth is similar in relation to registrations. These total numbers of EUTMs by year also show that despite a hesitant start from 1996 to 2000, from 2001 to 2021 there was continuous growth. This tendency however, stopped in 2021, as for the first time in 20 years there was a decrease in the number of Chinese applications in 2022. It is worth stressing that this was not a detail, as the extent of the decrease is not dismissible: the number of Chinese EUTM applications decreased from 34,353 in 2021 to 21,770 in 2022, a 37,70 % reduction. It is worth stressing that this reduction also occurred in the total of applications from all nationalities, being however a significantly smaller reduction (13,10 %). This growth and then decrease can more easily be seen in the following image:
Total RCD applications
The design numbers are very similar to those of trademarks. It is worth stressing that the statistics for designs in the EU start in 2003, instead of 1996 as happens for EUTMs.
The total number of RCDs received from Chinese applicants is 142,194. This represents 12,40 % of all RCDs and makes China the fourth country with more RCDs. However, in the years 2022 and 2023 China was the country with more RCD applications. It is worth mentioning that in 2023 the Chinese applications for RCD were almost double those of the second country with more RCD applications (Germany).
The growth until 2021 and subsequent decreases are also noticeable regarding designs. The reduction from 2021 to 2022 was 19.6 %, while the reduction of design applications from all nationalities in the same period was 9 %. Therefore, the reduction of Chinese RCD applications was more than two times higher than the reduction of applications from all countries.
EUTM and RCD applications by month
EUIPO's statistic studies also provide the number of applications by month:
- Jan - 13,412
- Feb - 9,232
- Mar - 15,936
- Apr - 15,216
- May - 14,337
- Jun - 15,706
- Jul - 16,746
- Aug - 16,062
- Sep - 14,931
- Oct - 10,463
- Nov - 12,787
- Dez - 15,665
- Total: 170,493
This shows that Chinese applicants file EUTM applications more often in July, and December (as the numbers for December 2023 are not included, it is highly likely that the total of December will be in second place) and August. Contrarily, the months when fewer applications are filed are February, October, and January.
- Jan - 9,740
- Feb - 7,092
- Mar - 11,988
- Apr - 12,208
- May - 12,059
- Jun - 12,931
- Jul - 13,582
- Aug - 12,842
- Sep - 13,706
- Oct - 9,238
- Nov - 12,745
- Dez - 14,063
- Total: 142,194
The preferable and least preferable months for filing RCD applications are similar: December, July, and September; against February, October, and January.
The most and least protected goods
The analysis of the classes of goods (and services for EUTMs) helps find some indication of the most exported goods and services by Chinese companies to the EU market (here and here).
The classes included in more EUTM applications from Chinese applicants are:
- Class 9 (51,012 EUTMs). We would say that the most relevant goods in this class are information technology goods, such as downloadable software, computers and smartphones and most of the accessories for these goods. The following is a list of some categories included in this class: Downloadable and recorded content; Information technology and audio-visual, multimedia and photographic devices; Magnets, magnetizers and demagnetizers; Scientific and laboratory devices for treatment using electricity; Apparatus, instruments and cables for electricity; Optical devices, enhancers and correctors; Safety, security, protection and signalling devices; Diving equipment; Navigation, guidance, tracking, targeting and map making devices; Measuring, detecting, monitoring and controlling devices; Scientific research and laboratory apparatus, educational apparatus and simulators.
- Class 21 (22,344 EUTMs). This class includes household goods. The following is a list of some categories included in this class: Household utensils for cleaning, brushes and brush-making materials; Tableware, cookware and containers; Cosmetic, hygiene and beauty care utensils; Articles for animals; Articles for the care of clothing and footwear; Bathroom fittings; Statues, figurines, plaques and works of art, made of materials such as porcelain, terra-cotta or glass, included in the class; Unworked and semi-worked glass, not specified for use; Gardening articles.
- Class 11 (22,250 EUTMs). This class includes: Sanitary installations, water supply and sanitation equipment; Burners, boilers and heaters; Lighting and lighting reflectors; Cooking, heating, cooling and preservation equipment, for food and beverages; Fireplaces; Filters for industrial and household use; Industrial treatment installations; Personal heating and drying implements; Drying installations; Refrigerating and freezing equipment; Regulating and safety accessories for water and gas installations; Nuclear installations; Heating, ventilating, and air conditioning and purification equipment (ambient); Igniters; Flues and installations for conveying exhaust gases; Sun tanning appliances.
- Class 25 (20,882 EUTMs). This class includes Headgear; Clothing; and Footwear.
- Class 28 (18,998 EUTMs). This class includes Sporting and physical exercise equipment; Festive decorations, party novelties and artificial Christmas trees; Fairground and playground apparatus; Toys, games, and playthings.
On the other hand, the products and services less present in EUTM applications by Chinese applicants are:
- Class 13 (189 EUTMs). Explosive substances and devices, other than arms; Weapons and ammunition.
- Class 23 (417 EUTMs). Yarns and threads.
- Class 45 (617 EUTMs). Safety, rescue, security and enforcement services; Personal and social services; Legal services; Political services.
- Class 4 (658 EUTMs). Fuels and illuminants; Electrical energy; Dust controlling compositions; Lubricants and industrial greases, waxes and fluids.
The classes of goods more protected by RCD by Chinese applicants are:
- Class 26 (20,033 RCD). Lighting apparatus.
- Class 14 (16,157 RCD). Recording, telecommunication or data processing equipment.
- Class 6 (15,366 RCD). Furnishing.
The classes of goods least protected by RCD by Chinese applicants are:
- Class 1 (117 RCD). Foodstuffs.
- Class 17 (214 RCD). Musical instruments.
- Class 18 (237 RCD). Printing and office machinery.
From the analysis of the classifications most often used for EUTMs and RCDs, it can be concluded that the goods to which EUTM and RCD protection is most sought by Chinese applicants are information technology goods (including accessories) and lighting apparatus.
EUTMs by type of trademark
Regarding the type of trademark, the distribution of the applications by Chinese companies and individuals is the following:
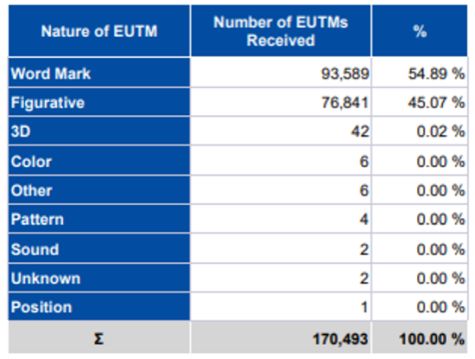
The percentage of figurative trademark applications from Chinese applicants is slightly higher than the percentage of figurative trademark applications filed by all nationalities (42%). This may be related to marks consisting of Chinese characters being considered figurative marks and not word marks.
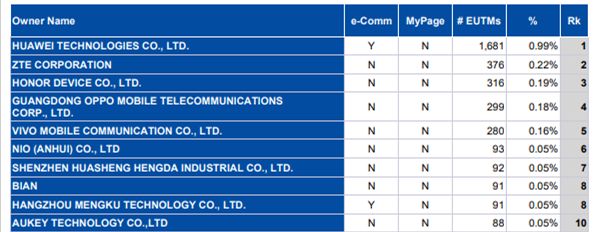
Top Chinese owners of EUTM and RCD
The top Chinese owners of EUTMs are:
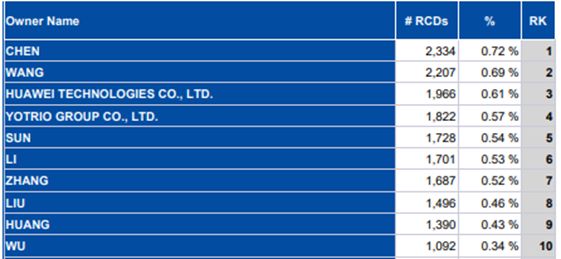
The top Chinese owners of RCDs are:
Conclusions
The number of EUTMs received from Chinese applicants totals 170 493 (until September 2023). This represents 6.16% of all EUTMs received and makes China the sixth country with more EUTM applications. However, if we only take the year 2023 into account, China is the country with more EUTM applications.
The total number of RCD received from Chinese applicants is 142 194. This represents 12,40 % of all RCDs and makes China the fourth country with more RCDs. However, in the years 2022 and 2023 China was the country with more RCD applications. It is worth mentioning that in 2023 the Chinese applications for RCD were almost double those of the second country with more RCD applications (Germany).
The number of EUTM and RCD applications by Chinese applicants steadily grew until 2021. From this year to 2022 there was a decrease that was more accentuated for Chinese applications (EUTMs 37,70 % and RCDs 19.6 %) than the decrease in applications from all countries (EUTMs 13,10 % and RCDs 9 %).
This statistics also allow us to conclude that the goods to which EUTM and RCD protection is most sought by Chinese applicants are information technology goods (including accessories) and lighting apparatus.
This article was originally published in IPR Daily. See here the Chinese version.
Footnotes
1. This article is based on information available as of November 3, 2023.
2. Available here, specifically the version concerning Chinese applicants https://euipo.europa.eu/tunnel-web/secure/webdav/guest/document_library/contentPdfs/about_ohim/the_office/statistics_per_country/SSC003.1%20-%20Statistical%20travel%20pack%20by%20country%20(CN).pdf accessed on November 3, 2023.
3. Available here https://euipo.europa.eu/tunnel-web/secure/webdav/guest/document_library/contentPdfs/about_euipo/the_office/statistics-of-community-designs_en.pdf accessed on November 3, 2023.
4. Available here https://euipo.europa.eu/tunnel-web/secure/webdav/guest/document_library/contentPdfs/about_euipo/the_office/statistics-of-european-union-trade-marks_en.pdf accessed on November 3, 2023.
The content of this article is intended to provide a general guide to the subject matter. Specialist advice should be sought about your specific circumstances.
