
Inflation is not dead. but merely hibernating and about to wake up
|
Following the recent political and geopolitical tensions driven by Brexit, Sino-US relations, raised trade tariffs and reduced global trade, the major economies had been relatively weak even before the current Covid-19 crisis erupted. This year's 'black swan' event could therefore have an historic and unprecedented impact on the fragile economies with significant socio-political consequences without the necessary policy support; particularly for Small and Medium Enterprises (SMEs) which form the backbone of the economies across the UK, Europe and US. Similar to the global financial crisis (GFC), the current pandemic is also expected to hit the advanced economies harder. The latest forecasts from the IMF, European Commission (EC) and ECB depicted in Figure-1 below highlight the relatively shallow recession for the global economy compared to those of the Euro Area and more specifically the southern European countries. The Euro Area in particular is expected to have an approximate 7.6% drop according to the IMF and EC for 2020, compared to the ECB's more pessimistic -8.7% baseline projection. To put these into recent historical perspective, the GDP correction experienced during the GFC in 2009 was -4.3%. FIGURE 1: GDP GROWTH FORECASTS FOR 2020 AND 2021 (IN %) |
|||||||||||||||||||||||||||||||||||||||||||||||||||||||||||||||||||||||||||||||||||||||||||||||||||||||||||||||||||||
Source: IMF, European Commission, ECB *World (excluding Euro area) real GDP; ** For 2020 Mild -5.9%, Std -8.7%, Severe -12.6%; *** For 2021 Mild 6.8%, Std 5.2%, Severe 3.3% |
|||||||||||||||||||||||||||||||||||||||||||||||||||||||||||||||||||||||||||||||||||||||||||||||||||||||||||||||||||||
|
The variation in potential growth rates across countries have been driven by the underlying sectoral biases, quality of healthcare provisions, initial lockdown measures and subsequent support provided. The unprecedented shutdown of the economy under lockdown, the drop in domestic demand and the fall in trade, which according to the UN Conference on Trade and Development is estimated to fall by a third, have all contributed to the malaise. Amongst the countries in Europe the UK has a wider dispersion of potential outcomes for 2020 and 2021 as seen in Figure-1, which is also depicted by HM Treasury's 1 independent forecasts in Figure-2 and the Bank of England's 2 latest Monetary Policy Report, May 2020, in Figure-3. The factors alluded to already are further complicated by the ongoing potential risks surrounding Brexit and the uncertain consequences of a no deal outcome. |
|||||||||||||||||||||||||||||||||||||||||||||||||||||||||||||||||||||||||||||||||||||||||||||||||||||||||||||||||||||
|
FIGURE 2: HM TREASURY - NEW INDEPENDENT FORECASTS FOR THE UK (MAY 2020) |
|||||||||||||||||||||||||||||||||||||||||||||||||||||||||||||||||||||||||||||||||||||||||||||||||||||||||||||||||||||
Source: HM Treasury, https://assets.publishing.service.gov.uk/government/uploads/system/uploads/ NOTE: This edition of the comparison contains 16 new medium-term projections for the calendar years 2020 to 2024, and the fiscal years 2020-21 to 2024-25. The table below summarises the independent average of new forecasts. |
|||||||||||||||||||||||||||||||||||||||||||||||||||||||||||||||||||||||||||||||||||||||||||||||||||||||||||||||||||||
FIGURE 3:Bank of England forecasts for the UK (Monetary Policy Report, May 2020) |
|||||||||||||||||||||||||||||||||||||||||||||||||||||||||||||||||||||||||||||||||||||||||||||||||||||||||||||||||||||
Source: Bank of England, Monetary Policy Report, May 2020 NOTES: (d) Excludes the backcast for GDP. (e) Annual average inflation rate. (f) Per cent. The path for Bank Rate implied by forward market interest rates. The curves are based on overnight index swap rate |
|||||||||||||||||||||||||||||||||||||||||||||||||||||||||||||||||||||||||||||||||||||||||||||||||||||||||||||||||||||
Policy support
FIGURE 4: Fiscal stimulus comparing Covid-19 to Global Financial Crisis (in US$) |
|||||||||||||||||||||||||||||||||||||||||||||||||||||||||||||||||||||||||||||||||||||||||||||||||||||||||||||||||||||
Source: ABP Invest, IMF |
|||||||||||||||||||||||||||||||||||||||||||||||||||||||||||||||||||||||||||||||||||||||||||||||||||||||||||||||||||||
As expected, the largest fiscal contribution in numerical terms has come from the US at near $3tn, followed by Germany and Japan at just over $1tn. The largest fiscal contribution in relation to the size of the country's economy, however, has been Germany with just over 30% of GDP, followed by Italy at 27%. The US has lagged behind due to partisan disagreements between the House and Senate a few months before US elections in November. Last, but not least, the UK and France have provided similar fiscal support packages of approximately 17% of GDP.
|
|
|||||||||||||||||||||||||||
Source: ABP Invest, IMF, World Bank |
Alongside fiscal policy and despite not having much room to play given low interest rates, monetary policy has also made its mark as depicted in in Figure 6 on the following page. It is worth noting the relatively contained response of the ECB which following the latest German constitutional court's ruling may have a smaller part to play going forward, especially as German Chancellor Merkel and French President Macron are trying to push through the franco-german EU recovery fund which would signify the first step towards a fiscal union.
Figure 6: Covid-19 Monetary policy stimulus as % of GDP, as of May'20
Source: Nordea, IMF |
The critical role of SMEs
The significance of SMEs cannot be overstated, being the backbone
of major economies and widely representative across food,
accommodation and tourism sectors hit the most during this
pandemic. In the UK, for example, 60% of all employment is with
SMEs as per Figure 7 below.
Figure 7 - Importance of SMEs in the UK
|
Private sector businesses in the UK by number of employees, 2019 |
||||||
|
Businesses 1000s |
Employment 1000s |
Turnover £ billions |
Businesses % |
Employment % |
Turnover % |
|
|
No employees |
4,458 |
4,835 |
305 |
76% |
18% |
7% |
|
SMEs (0-250 employees) |
5,860 |
16,630 |
2,168 |
99.9% |
60% |
52% |
|
Of which: Micro (0-9 employees) |
5,613 |
9,041 |
900 |
96% |
33% |
22% |
|
Small (10-49 employees) |
211 |
4,117 |
629 |
4% |
15% |
15% |
|
Medium (50-249 employees) |
36 |
3,473 |
639 |
1% |
13% |
15% |
|
Large (250+ employees) |
8 |
10,868 |
1,982 |
0% |
40% |
48% |
|
Total, all businesses |
5,868 |
27,498 |
4,150 |
100% |
100% |
100% |
Source: BEIS, Business Population Estimates, 2019, Table 1
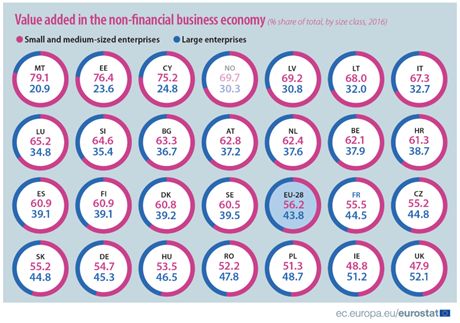
The significance of SMEs may be high in the UK, but it is even higher across Europe. To put into perspective, the UK has the smallest share of SMEs to overall company turnover when compared with the EU. Figure 8 on the following page below highlights the importance of SMEs (as a % share of overall turnover) and how it declines from Malta on the top left with 79%, to Italy at 67%, Germany at 55% and UK 48% at the bottom right of the chart.
Figure 8 - Importance of SMEs in the EU (in descending order from top left)
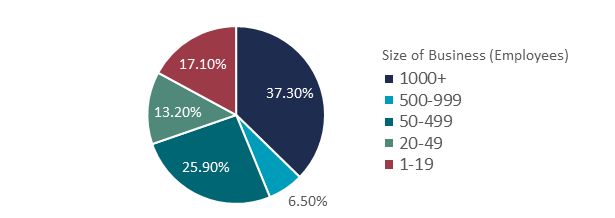
Lastly, in the United States small businesses (less than 500 people) employ just under 50% of the total private workforce. This becomes particularly pertinent during economic slowdowns and especially during crises like those experienced today with nearly 1 in 4 Americans having lost their job (temporarily or permanently).
Figure 9 highlights that although 37.3% of all lost payrolls in April 2020 were for the largest firms with over 1000 employees, 56.2% of all losses were represented by firms with less than 500 employees. Furthermore, smaller firms have had a disproportionate loss of payrolls with those employing 20-49 worst off at 21.4% of all those employed (Figure 10 on the following page), whereas employees in larger firms were relatively better protected with only 13% of those positions lost. It is evident that those working for larger firms are protected the most.
Figure 9 - Total payrolls lost YTD as % of total losses, by firm size
Source: ABP Invest, Federal Reserve Bank of St. Louis
Figure 10 - Percent of payrolls lost YTD in each firm size category

Source: ABP Invest, Federal Reserve Bank of St. Louis
So what will it be: V, U, W Or L?
There have been a plethora of symbols and letters to denote the
expected economic recovery out of Covid-19. The sharp equity market
rally since the lows in March suggests a 'V' recovery
following the unprecedented policy stimulus provided. In my view,
this is too optimistic. The stimulus may have been unprecedented in
both speed and size (if not by coordinated action) but so has the
economic impact and in particular across the SMEs. Hence, I would
expect the recovery to be slower than market expectations with a
'U' instead of a 'V' and a subsequent rise in
market volatility. On a more positive note, however, the latest
data on Covid-19 alongside continuing government support suggests
we will be able to avoid an 'L' type scenario.
And finally, what is the impact for pension funds?
Roger Bootle's 1996 book "The Death of Inflation" has turned out to be quite prescient. Despite the trillions of dollars pumped into the global economy by major central banks alongside negative interest rates, inflation has continued to defy economists, politicians and central bankers. Will the recent Covid-19 fiscal and monetary stimulus make a difference?
Abundant liquidity and inflationary targets have thus far failed to deliver rising prices. This may have been partly due to demographics, technological advancements and globalisation which characterized the period since the GFC. But this is changing: (1) globalisation is receding with supply chains coming closer to home where fixed costs are higher, alongside elevated trade tensions and tariffs; (2) unlike the policy support following the GFC which targeted systemic institutions, the current stimulus is broad and widespread amongst households and businesses; (3) the level of stimulus is unprecedented as discussed earlier. Hence, I expect to see government bond yields rising in anticipation of higher prices, with more lenient central banks and policy makers willing to see inflation eroding part of the huge levels of debt the global economy will have amassed by the end of 2021. We may not see an imminent rise in prices as the global economy is still on the back foot, but forward looking asset prices should start taking this potential structural shift into consideration.
Footnotes
1. HM Treasury, Forecasts for the UK economy: a comparison of independent forecasts, May 2020
2. Bank of England, Monetary Policy Report, May 2020
The content of this article is intended to provide a general guide to the subject matter. Specialist advice should be sought about your specific circumstances.
