To read this Report in full please click here.
FOREWORD
Welcome to Under The Microscope: A review of the UK Technology sector. This review is based on detailed analysis of corporate reporting by public Technology companies in the UK as told through their annual reports, together with comments on the backdrop of corporate activity that has marked out the sector in recent years. Often it is difficult when confronted with an external reporting challenge to look around at one's peer group and answer the age old question "How does everyone else do it?" Our aim in this review was not only to provide some answers to this question, but to provide insights into how different companies are addressing the same challenges; not just in corporate reporting but in how to explain their results to the market or describing how key industry developments are impacting them. It is often only once the "how?" is understood that the "why?" and "what do we do?" questions can be answered.
Our review is based on publicly available data for financial years ending in 2009 or early 2010. The backdrop to this reporting season was the tentative steps out of recession, an increase in Mergers and Acquisitions ("M&A") activity, a lack of flotations and the presence of disruptive new business models and technologies such as Software as a Service ("SaaS") – and these themes run through the commentary.
There are many ways to define the Technology sector. Our report was created based on the review of a group of approximately 70 UK public Technology companies. It is an eclectic group as the companies' share price information can be seen listed, depending upon which daily newspaper you read, under classifications as diverse as "Technology", "Hardware", "Electronic and Electrical Equipment", "Aerospace & Defence", "Software & Services" and "Support Services". For now we have excluded AIM listed companies. When we set out on this project we wanted to provide information that has broad appeal – the information in this report will be of interest to all Technology companies, public or private, large or small.
Our review is aimed at Finance Directors or CFOs, Financial Controllers, Audit Committee Chairs and Auditors, all of whom need to perform benchmarking and sense-checks as part of their roles when it comes to working on the annual report and accounts. I hope you find this an informative read and a point of reference to help answer some of the questions posed above for your 2010/2011 reporting season. Obviously we would be delighted to discuss the review with you. We welcome your feedback on what might be helpful for you to have in future. We look forward to speaking with you.
Peter O'Donoghue
Head of Technology
Deloitte
KEY FINDINGS
As with any review, whilst the numbers may paint a picture, they do not tell the whole story behind them. Whilst we have tried to pull together potential key themes, the drivers for each business will be different, and certain complicating factors (such as the impact of M&A activity on headline numbers) have not been pulled out. The data and the analysis gathered and made herein have been done in good faith and are designed to be a material representation of trends rather than a micro piece of analysis. We believe that the value in our review is in you taking the trends we have identified and applying them to your individual circumstances, to draw out your own conclusions and thereby approach your upcoming reporting season with a perspective of where you sit amidst your peers.
Our analysis looks at several aspects of the business environment that our group of companies found themselves in, and how these were reported in their published annual reports for the financial years ended 2009 and early 2010.
The key findings were as follows:
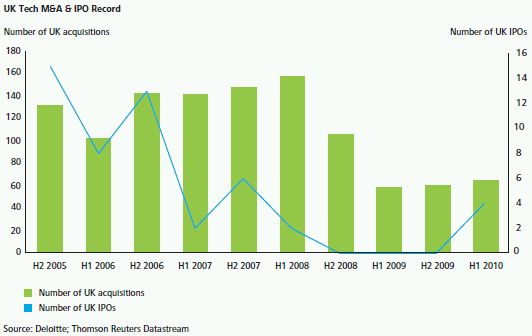
Technology sector M&A activity levels dropped off significantly during the credit crunch with a number of deals falling over either due to divergent pricing expectations or a lack of available funding. Activity levels have started to pick up over the last 18 months, although they remain a long way from historical levels. The Initial Public Offering ("IPO") market fell just as sharply as the M&A market; however, it has not seen anything like even the modest recovery experienced by the M&A market. There were three consecutive halves of no Technology UK IPOs between H2 2008 and H2 2009. H1 2010 did see some return to activity with two main market Technology listings. The past few years have seen a number of takeovers and de-listings, with 13 listed Technology take-overs valued in excess of £200m since January 2007. Three of these were by US buyers and an interesting new trend is emerging with Indian and sovereign wealth buyers completing two transactions in the period. And 40 is the magic number – our assessment was that typical bid premiums paid on both UK and global deals clustered around the 40% mark. These findings mirror the industry's own views, as set out in our Technology M&A survey.
Against the background of challenging economic times, corporate reporting comes under increased scrutiny. We investigated some of the key corporate reporting trends, identifying the following:
- The UK Technology sector is, on balance, growing, in these tough times, and the Technology sector's revenue recognition complexities are clear. Total revenue for our population increased by 5%, with 59% of companies achieving some level of top line growth and 15 companies reporting revenue growth of over 20%. Revenue recognition was cited as a critical accounting judgement by 44% of companies, with the average revenue recognition policy stretching to 22 lines (although a sizeable majority disclose far less than that despite a push in recent years for more transparency). The importance of understanding the complexities of revenue recognition was highlighted by our recent publication identifying some of the potential challenges for Technology companies in the new revenue recognition exposure draft (see www.deloitte.co.uk/techrevenuerecognition).
- Our view is that the sector was well prepared for the credit crunch given cost reduction steps taken as a matter of course in recent years. Revenue growth was surpassed by a growth of 8% in adjusted operating profit metrics, although there was not a rush to disclose stronger earnings measures, with only 28 companies identifying EPS as a Key Performance Indicator ("KPI"). Operating profit growth was perhaps impacted by the 54% of companies who reduced overall headcount year on year. Taking only companies with a net increase in staff numbers (therefore crudely trying to remove the distortive impact of significant redundancy payments), average salaries rose by 3% (compared to average board remuneration increasing by 2%) which, while modest compared to increases in the cost of living, was above many other professional staff sectors, indicating that there may still be a shortage of the right skilled staff in Technology industries. The value of employees to companies was supported by the 62% who identified attracting and retaining talent or management succession and leadership as a key risk to their business.
- Previous M&A activity and market consolidation has left a legacy of goodwill and intangible asset balances, and 69% of companies highlighted the carrying value of goodwill as a critical accounting judgement. The average discount rate used in impairment reviews was 11% (ranging between 6% and 25%). As an indication that companies are still bullish regarding future prospects, the average growth rate over the forecast period was 5% (range: 2% to 20%) and the average long term growth rate was 2% (range: 0% to 8%) with software and services having the highest forecasted growth rates. The most commonly recognised acquisition intangible assets were software licenses, trade names and customer relationships, with modal average useful economic lives of 3-5 years, 5-10 years and 3-10 years respectively. The industry's general mistrust of the mandatory capitalisation of qualifying development costs required by International Accounting Standards was borne out with only 26% of total R&D expenditure being capitalised.
- Corporate governance disclosures are also an increasing focus of investor and commentator attention, with the expectation that this will only increase. Our review identified that 65% of companies had a board comprising at least 50% non-executive directors and 73% had an independent chairman, both of which are key Combined Code corporate governance recommendations. The total value of non-audit work performed by auditors was 73% of audit fees (with 72% of companies reporting non-audit fees below audit fees); of non-audit fees 52% were for tax services and 26% were for corporate finance services.
- The Financial Reporting Review Panel's 2010 annual survey highlighted that narrative reporting is "claiming an increased proportion of our attention". We noted the fact that fewer KPIs are disclosed by Technology companies than those in other sectors, with a surprisingly low focus on non-financial measures, and that more could be said on emerging priority areas like environmental and ethical considerations. Tax, paradoxically, is an oft-quoted critical judgement area that is rarely measured as a KPI in public. Investment in research and development runs at around 6% of revenues, on average, but only a quarter of it ends up capitalised and, when making acquisitions, there is evidence that UK entrepreneurship is alive and well and that, despite (or perhaps helped by) a lack of detailed rules on how to go about it, customer related assets are the most frequently capitalised acquired intangible.
SETTING THE SCENE: M&A, IPOS AND VALUATIONS
Introduction
A key aspect that impacts corporate reporting for the public Technology sector in the UK is activity around M&A which, given the nature of the sector, is historically high. This retrospective analysis of UK Technology companies yields some interesting thoughts on M&A deals that have recently happened, which should be considered by business leaders whilst planning M&A strategies going forward. Our forward looking publication, The Deloitte UK Technology M&A Survey, examines management teams' views on potential future M&A in the sector. (see www.deloitte.co.uk/techmandasurvey2H2010).
M&A activity levels reduced significantly during the downturn although this has shown some signs of recovery in more recent months. We explore trends arising from completed deals and consider a number of M&A related factors which may impact on the number of Technology takeovers going forward.
Recent UK Technology M&A and IPO Trends
As with the general buyout market, Technology M&A activity dropped off significantly during the credit crunch with a number of potential deals stalling either due to divergent pricing expectations or simply a lack of available funding to finance deals. Activity levels have started to pick up more recently; however they remain a long way off historical levels.
The number of UK IPOs on the main market and AIM fell sharply as investor confidence waned with September 2007 marking the tipping point in confidence. Reflecting back on this critical time, 3i's successful IPO of Telecity for £436 million occurred just as Smartstream's IPO (following previous pricing reductions from £300 million to £200 million) was pulled. Smartstream was subsequently acquired by Dubai International Capital in December 2007. It is also worth noting that of the £96 million proceeds raised on Telecity's float, £71 million was used to de-gear Telecity's balance sheet. In more recent times, potential IPO investors have treated the listing of leveraged PE companies with significantly more caution reflecting reduced investor appetite in such instances.
In 2010, the number of UK Technology IPOs remained low but improved with London having main market listings for Promethean and CPP Group, as well as London Alternative Investment Market IPOs for Digital Barriers, EMIS and CSF.
The Future of the Public UK Technology Sector
As global economies start to show some sign of recovery from the recent downturn, what is next for the UK listed Technology sector? There are a number of factors to consider when forming a view on whether the recent trend of public UK Technology takeovers is likely to continue.
The following themes indicate a likely continuation of takeovers and are explored in more detail within this section:
- expanding war chests of U.S. Technology Corporates whose senior management teams have indicated that acquisitions are high on their agendas;
- technology companies have conserved and managed cash during the downturn;
- strong premiums paid on recent takeovers as companies look to acquire specific core skills or gain entry into new sectors;
- large number of private equity houses with significant funds available for investment; and
- emerging sub-sectors being sought after by global players including data centres, Software-as-a-Service and Virtualisation.
Bid defence may prove to be a key area for the sector as companies attempt to fend off further hostile takeover approaches.
On the other hand, there are a couple of reasons that may suggest a strong future for the public UK Technology sector including:
- a share price recovery in the public UK Technology sector in excess of the general UK market since the credit crunch; and
- positive sentiment about prospects with the ongoing migration to cloud computing driving future growth.
The recent Deloitte CFO Survey for Q4 2010 highlights that credit conditions for big corporates remain very favourable. CFOs say that the cost of new credit is lower than at any time since 2007. Moreover, CFOs see borrowing - whether from banks or through corporate debt issuance – as offering a far more attractive way of funding their businesses than issuing equity and this provides strong opportunities for expansion by the public UK Technology sector. The survey is available electronically from the Deloitte website at www.deloitte.co.uk/cfosurveyq42010
UK Technology Companies Have Made Attractive Targets
Since we started tracking the public UK Technology sector in January 2007, there have been a number of takeovers and de-listings. Conversely the number of new entrants via IPOs has been minimal.
Our analysis of acquisitions with a disclosed value of over £200 million (see table below) shows the continuing trend of public company takeovers. For a number of private companies, IPOs have been deferred as a result of the weakness of the capital markets and, instead, companies have sought alternative forms of refinancing or an exit through trade or private equity sale.
For deals shown below, just under two-thirds were to trade buyers and one-third to private equity. Whilst this may, in the first instance, highlight the additional synergy value that trade buyers can attach to their bids, it also reflects the impact of the tightening of credit markets on private equity buyers over this period, thus constraining their activity levels.
In terms of the geographic location of Technology buyers, the United States led the charge in terms of overseas buyers (three deals), confirming its historical position as a keen buyer of UK Technology. The UK itself accounted for five deals with the remainder shared amongst overseas buyers. Our analysis also flags that the emergence of sovereign wealth buyers (Dubai International Capital) and Indian buyers for UK Technology albeit activity levels have been limited to date.
Premiums paid on the takeover of UK Technology plc varied significantly depending on the target's sector, level of competition and strategic imperative for the buyer. Whilst there are exceptions, the average bid premium was around 40% of the closing share price prior to the announcement date.

UK Technology Performance
There has been increased volatility in recent years and share prices have fluctuated significantly. In line with global markets, the Datastream UK Technology share price index fell sharply during the downturn in 2007/08, however there has been a sharp rebound during the past two years, in particular within the UK market where the index has risen above 2007 levels. UK Technology companies have experienced challenging market conditions since 2001 and many implemented cost reduction programmes prior to the recent downturn, helping to prepare them to ride the credit crunch.
In line with the general upward share price trend in the Datastream UK Technology index, many companies are currently trading close to their highest point within the previous 12 months. At 30 November 2010, 54% of the companies reviewed traded within the top quartile of their share price range for the previous year.

Market Capitalisation Multiples
Revenue Multiples
From our sample of companies, 28 had declining revenues reported in their most recent financial statements including 55% of the hardware companies, compared to 40% of the remainder. Our analysis highlights the following trends:
- the largest companies showed limited revenue growth;
- a number of hardware companies experienced small or negative revenue growth at a time when many organisations have reduced their levels of capital expenditure;
- there are a large number of software companies, including many of the larger businesses, reporting little or no revenue growth; and
- companies with market capitalisation versus revenue multiples above four have frequently been in the press as suggested takeover targets, including ARM Holdings, Autonomy and Telecity.

EBITDA Multiples
The graph below shows our sample of companies with EBITDA multiples in the range of 0 to 20. This table excludes the nine companies which had negative EBITDA within the most recent year of the financial statements. Our analysis highlights the following trends:
- some of the larger software companies had smaller EBITDA percentages despite the fact that many smaller software companies are achieving high EBITDA levels;
- the services companies achieved low EBITDA; and
- Aveva achieved a large EBITDA percentage despite negative revenue growth.

Expanding "War Chests"
US Corporates have historically been major acquirers of UK Technology companies and recent discussions with senior management at some of the largest global Technology companies confirm that acquisitions are high on their agendas and that many are looking to accelerate their technological capability by acquiring specific core skills or gaining entry to new sectors.
And they are very well placed to make future acquisitions. The top eight U.S. Technology Corporates had cash and cash equivalent positions totalling $205 billion in their latest published company accounts. Their cash reserves have continued to grow, increasing their cash positions by an average of 15% for their latest third quarter reporting, compared with their most recent full year results.
American firms continue to search for opportunities in the UK Technology sector, and companies who have deflated share prices, high cash reserves or who operate in emerging sub-sectors may be attractive targets.
The public UK Technology companies that have been included within our benchmarking sample had combined cash and cash equivalent reserves of £2.9 billion at the end of their last financial year and 50% of companies had net debt under £10 million. Cash flows generated from operating activities during the same period totalled £4.3 billion.

Premiums Paid on Recent Global Takeovers
The following table shows a selected sample of large global Technology deals since 2009 (excluding private equity), along with the premiums paid on the share prices immediately before the announcements of the proposed deals. The data shows a cluster of premiums around the 40% mark, similar to the average premiums paid by UK-based takeovers over £200m since January 2007.
A number of factors have led to higher premiums being achieved, for example where buyers seek to:
- provide a complete integrated range of hardware, software and IT services;
- achieve deep integration of software and hardware products to address changes in mobility usage of Technology;
- capture higher end advisory services as pricing competition increases; or
- accelerate product innovation.

Emerging Technology Sub-Sectors
There are many emerging Technology sub-sectors high up on management's M&A strategy, with a number of companies keen to enter into these markets for the first time or to strengthen their existing positions.
Data Centres
Many organisations continue to evaluate their data storage efficiency and security capabilities, putting pressure on providers to deliver reliable and cost efficient solutions. The large global players are competing intensely in the data storage market as illustrated by the 3PAR bidding war between Dell and eventual winners HP, who were prepared to pay an 86% premium for the August 2010 acquisition. Dell has also made a number of other related acquisitions including Ocarina, EqualLogic, Exanet and Scalent, whilst HP has acquired Fortify Software, Stratavia and ArcSight. IBM and Cisco continue to grow their data storage offerings including the IBM acquisitions of Storwize and the recently announced Blade Network Technologies deal, plus last year's Cisco acquisition of Tidal Software.
SaaS
Software-as-a-Service is a software delivery model whereby an enterprise vendor develops a web-based software application allowing customers to access a suite of software offerings on a hosted pay per use basis. It is one of the fastest growing segments of the Information Technology sector and is expected to cut costs and increase efficiency. Many IT providers have SaaS on their agendas and Microsoft recently took a big step forward towards full SaaS solutions with the announcement of Office 365, a Cloud-based version of its complete Office applications suite.
We anticipate continued consolidation in this area and a number of related M&A deals as players seek to build up their capabilities and offerings. Examples of completed deals include Cisco's acquisition of Scansafe, IBM's acquisition of Cast Iron Systems, the Salesforce.com acquisition of Jigsaw and Red Prairie's acquisition of WMS Smart Turn.
Virtualisation
Server virtualisation is seen as one of the key building blocks for cloud computing infrastructure, a concept which remains on the agenda of many management teams across the globe. Oracle's Virtual Machine "OVM" is an evolving server virtualisation software boosted by acquisitions of Sun and Virtual Iron.
Buy-Side Acquisitions During the Past Financial Year
Our recent Technology M&A Survey suggests that many companies are positive about their prospects of making future acquisitions. Many companies have already refinanced and are experiencing growing cash reserves as they emerge from the downturn. It is worth noting that the UK companies who have continued to make acquisitions during the period are fast growing and typically have higher EBITDA margins.

Other Drivers for Consolidation
Gearing
We have compared the ratio of the sum of total debt and financial lease obligations to the market capitalisation for our sampled companies at the balance sheet date of the reviewed financial statements. The table shows that only nine companies had gearing ratios in excess of 50% which highlights the focus on cash conservation, debt management and cost control during the downturn.

Pension Deficits
The pricing of M&A deals will typically be influenced by the presence of any sizeable defined benefit pension deficits. This also adds a level of complexity to the deal structuring, as pensions trustees will want to make sure that future funding is secured regardless of which party retains ownership of the scheme.
From our sampled data, as at the balance sheet date of the reviewed financial statements, there were only two companies with pension liabilities over £100 million. There are only three companies with a pension deficit greater than 10% of the market capital at the balance sheet date. Almost half of the companies in our sample had no defined benefit schemes, indicating that the UK Technology sector does not suffer as greatly as other UK sectors from legacy defined benefit deficits, which avoids one potential obstacle for M&A activity.

CORPORATE REPORTING IN 2010
CORPORATE GOVERNANCE
Introduction
Corporate governance covers a wide range of issues affecting all companies including listed businesses that are required to comply with the UK Corporate Governance Combined Code and smaller companies who are looking to effectively manage their risks. Our review focused on our observations on the practices and the disclosures that Technology companies make in the following two key areas:
- Auditor's remuneration – the level and nature of non-audit fees.
- Board composition – the make up, roles, responsibilities and structure of the board of directors.
Auditor's Remuneration
Guidance in respect of the disclosure of auditor's remuneration is provided by the statement made by the Institute of Chartered Accountants in England and Wales ("ICAEW") who published Tech 06/06 "Disclosure of auditor remuneration" in October 2006 subsequently updated in July 2007. This statement requires specific disclosures including the split of fees paid to auditors between:
- fee payable to the Company's auditor for the audit of the Company's annual accounts; and
- fee payable to the Company's auditor and its associates for other services.
The statement goes on to require other services to be split into a number of sub-headings including the audit of subsidiary accounts, other services relating to taxation, internal audit fees and services relating to corporate finance transactions.
Disclosure
All the FTSE Listed companies included disclosure analysing the level of fees earned by their auditors split between audit and non-audit fees as required by the guidance. Non-audit fees were most commonly analysed into taxation services, corporate finance services, SEC reporting and other services.

This analysis reveals that the sample of companies incurred a total of £19.6 million in non-audit fees in the reporting period, the majority of which related to taxation services (52%).
The Level of Non-Audit Fees
|
Hot topic The Auditing Practice's Board ("APB") October 2010 consultation followed a report last year by the House of Commons Treasury Committee which proposed a ban on the auditor providing non-audit services. The consultation generated a substantial number of responses from all APB's stakeholder groups, in particular, including the views of a range of investors. The overwhelming view of respondents (irrespective of the constituency involved) was that there should be no outright prohibition on non-audit services. APB says, however, that a perception remains that auditor objectivity and independence is adversely affected by the provision of non-audit services and that improved transparency and governance would address these concerns. As a result, the APB has issued, in December 2010, revised Ethical Standards for Auditors. Alongside this, the FRC's Guidance on Audit Committees includes changes that provide a clear framework on which to assess when it is appropriate for auditors to provide other services. |

Of the 28% of companies that reported higher non-audit fees than audit fees, six were FTSE 250. These six companies incurred a total of £10.0 million in non-audit fees for the most recent reporting period compared with audit fees of £5.0 million, which could lead to a perceived risk of non-independence.
The total value of non-audit work across all the companies totalled £19.6 million compared with audit fees of £26.9 million. Although companies continue to see the benefits in using auditors who know and understand their business for other services, it is likely that further regulation will be required that will at a minimum require further disclosure in the financial statements.
Few public UK Technology companies use audit firms excessively for non-audit services, where "excessive" is crudely defined as non-audit fees greater than audit fees. Almost all Technology companies use their audit firms for more than just audit. So it seems to us that any change in regulation in this area would have a significant effect on the sector.
Board Composition
The overall average number of company directors in each business in our review was 6.75. The largest number of directors in any company was 13 with the lowest being two. The companies at the lower end of the range tended to be smaller businesses with an average turnover of £50 million with two or three notable exceptions including a FTSE 250 company.
The average turnover of those companies with nine or more directors was £1.3 billion and included four of the five FTSE 100 companies. There was again a notable exception whereby two smaller plcs, one with a turnover of less than £50 million, had nine directors.

However, taking the 26 FTSE 250 companies alone leads to a marginally higher average number of directors of 7.92 compared to just over six for non-FTSE 250 companies suggesting that size alone may not be the key factor when assessing the size of the boardroom of a Technology company. Specific provisions of the Combined Code There are certain provisions of the code regarding board composition that are regarded as best practice most notably:
- Code provision A2.2 – The chairman should on appointment be independent; and
- Code provision A3.2 – except for smaller companies, at least half the board, excluding the chairman, should comprise non-executive directors determined by the board to be independent. A smaller company should have at least two independent non-executive directors.
Of our sample of companies 65% had a board composition where at least 50% of the board consisted of nonexecutive directors. The last Deloitte survey on narrative reporting in the UK, 'Swimming in Words' identified that only 39% of the top 350 companies complied with this rule suggesting that Technology companies value the input of a non-executive directors more than in other sectors.
Only 27% of the companies did not comply with provision A3.2 of the code regarding the existence of an independent chairman. This compares with 13% of the FTSE 250 companies across all sectors. Only five companies were identified as having the same CEO and Chairman of which two reported turnover of less than £5 million. Two of the remaining three companies are members of the FTSE 250 where there is a growing expectation that these companies would have two separate individuals in these roles.
PERFORMANCE IS KEY: KPI REPORTING
Introduction
A business review is required by the Companies Act 2006 to include, to the extent necessary for the understanding of the development, performance or position of the business of the company:
- an analysis of the financial key performance indicators (KPIs); and
- where appropriate analysis using other KPIs, including information relating to environmental matters and employee matters.
The law defines a KPI as a factor by reference to which the development, performance and position of the company's business can be measured effectively.
The Accounting Standards Board's 'Reporting Statement: Operating and Financial Review' (RS) states that KPIs judged by the directors to be effective in measuring the development, performance and position of the business of the entity, should be disclosed and suggests that the following should be disclosed for each KPI:
- the definition and its calculation method;
- its purpose;
- the source of the underlying data and an explanation of any assumptions used;
- quantification or commentary on future targets;
- where information from financial statements has been adjusted for inclusion in the OFR, a reconciliation between these figures;
- corresponding amounts for the prior period; and
- any changes to the KPIs.
Findings
The last Deloitte survey on corporate reporting in the UK, 'Swimming in Words', identified an average of seven KPIs disclosed per company with four being financial and three being non-financial. In the last survey, the most common were profitability, shareholder return and employee related measures.
Our analysis identified a total of 393 key performance indicators across the group. An average of five KPIs was identified for each company in the group with seven companies not explicitly identifying any KPIs. On average, support services companies identified the most KPIs with an average of 7.7 per company. A trend emerged that larger companies tended to identify more KPIs and those companies of our group within the FTSE 100 identified an average of 8.3 KPIs. 'Swimming in Words' identified an average of 7 KPIs per company with larger companies identifying 10 on average. Of the companies analysed in our review, the 10 largest companies identified an average of 7.4 KPIs whilst the smallest 10 companies identified an average of 3.9 KPIs. It is clear from this analysis that larger companies tend to have more and a broader range of KPIs in their business review which would be the result of having greater complexity and more stakeholders.
The 'Swimming in Words' report is available online at www.deloitte.co.uk/swimminginwords
The highest number of KPIs a company identified was 16 with the lowest number of those identifying KPIs being three.

The results of our overview suggest that Technology companies in the UK tend to put a lower emphasis on nonfinancial KPIs than other corporates when compared with the findings of 'Swimming in Words'. An average proportion of 80% of KPIs of a financial nature and 20% of a non-financial nature was reflected in the sample, a relatively low proportion when compared with 'Swimming in Words' which identified a ratio of 65% financial and 35% of a non-financial nature. As a consequence of our focus on Technology companies, our sample included a higher proportion of smaller companies than 'Swimming in Words' with the results supporting observations in that survey that smaller companies tend to have a smaller range of KPIs and provide fewer non-financial KPIs.

Software and Hardware companies showed similar preference to income statement, cash and non-financial KPIs. Support services companies showed the greatest use of balance sheet KPIs, followed by Hardware companies and then Software companies. Electronic and Electrical companies and Aerospace and Defence companies did not show any balance sheet measures.
Hardware companies tended to show the greatest proportion of non-financial KPIs with an average of 23%. For an individual company the highest proportion identified for non-financial was 67% non-financial in a Software and Services company, these included amongst others, the number of revenue generating clients, the geographic dispersion, customer satisfaction, reportable accidents and CO2 emissions.
Larger companies tended to have a more even spread of KPIs analysed between our five key categories: Income statement, balance sheet, capital related and non-financial. Despite this, it was clear that balance sheet measures do not feature highly in the list of KPIs; however cash and capital related KPIs tended to have good prominence, which could indicate management has alternative ways of measuring balance sheet strength.

What Type of Financial KPIs Were Identified?

The most common KPIs by far related to income statement measures making up 60% of all financial KPIs on average.
Income Statement Measures

Profitability is identified by the companies reviewed as the most important measure making up 53% of all KPIs, of which approximately half were a numeric measure with the remainder focusing on a measure of profit margin. Only four companies identified the growth of a profit measure as a KPI. We note that 24 companies did not identify a numeric profit measure as a KPI, however of those, 21 identified either margin or profit growth instead. Of those companies that explicitly identified KPIs, only four companies did not identify any profit related KPIs.
In our sample, adjusted measures were less common, with only 15 companies identifying an adjusted profit measure and 14 companies identifying an adjusted profit margin measure explicitly as KPIs. The most common adjustments related to exceptional items, amortisation, share-based payments and restructuring costs.
Revenue measures represent 32% of all KPIs indicating significant emphasis by Technology companies on the top line. Most companies identified a revenue measure as a KPI, of which the majority identified total revenue. 16 companies did not include any measure of revenue.
Tax related measures were much less prevalent as KPIs. With tax affecting the bottom line and any group's net cash flows, is more emphasis on tax necessary? To do so would certainly align management's focus with shareholders' interest in earnings related value. One company identified two tax KPIs which included the effective tax rates and the underlying tax charge. Expense measures were more common with 10 companies identifying expense measures, the most common related to interest cover followed by R&D spend and operating expenditure measures.
Revenue Growth
Given the recent economic climate, the ability of all businesses to grow their top lines has been challenged. Technology companies are impacted in different ways, depending on their products. Some can be leaders of economic conditions as consumers and enterprises seek to reduce or delay expenditure whereas others drive reduced costs for their customers and therefore can see stabilising or even growing revenues as customers look to contain costs.
Total revenue for our population of companies, increased over the prior year by 5%, but this general trend masks a wide variation in performance as demonstrated in the table below:

Clearly factors other than economic conditions such as acquisitions and disposals or exchange rate fluctuations also impact top line performance. However, on a raw numbers basis, 59% of the sampled companies achieved some form of top line growth, the largest being NXT with 62% growth.
Just over half of companies reviewed included some variant on a theme of "customer concentration" or "competitive market", within their key risks indicating that focusing on customers was high on management's lists of priorities. As well it might be, given that an average of 4.5% of year end debtors had been provided for at year end.
Profit Growth
This overall growth in revenue was more than bettered by increases in profitability with an overall increase of 8% in adjusted operating profit metrics and an increase in average adjusted operating profit margin of 9% from 9.9% to 10.7%. Profit growth outstripping revenue would perhaps be indicative of strong cost control with people costs representing a significant percentage of many Technology companies' costs (32% of revenue in the most recent year).
Headcount and Pay Trends
However, whilst 38 companies sampled (54%) reduced overall headcount year on year, 33 companies (46%) increased it. The net impact was that a total of 227,872 people were employed by the companies in our sample at the end of the current period, which represented an increase of 1% from the previous year figure of 225,576.
Our review identified that average total staff costs increased by 7% over the previous year which whilst consistent with the revenue growth identified above could be influenced by a number of factors such as redundancy payments. For companies recording a net increase in the number of staff employed year on year, the increase in average remuneration per employee was 3%, which whilst relatively modest, was more than other professional staff may have received during recessionary times, indicating that there may still be a shortage of the right skilled employees.
This increase is consistent with the level of remuneration of boards which increased by 2% over the same period.
Identification and retention of key employees and personnel is often highlighted by Technology businesses as a key operational issue, and almost two-thirds of companies reviewed highlighted this (or something similar) as a key risk to their business.
Other Financial Measures
As a measure of shareholder return, Earnings Per Share (EPS) would rank at the top for shareholders' focus. Only 28 companies identified an EPS measure as a KPI, of which three identified more than one measure of EPS. These included adjusted EPS and diluted EPS. Seven companies included dividends per share and 12 companies identified other measures such as return on assets, shareholder return and return on capital employed. In the current interest rate environment, investors and savers alike are looking for good cash generating returns that beat inflation at the very least. With these measures not featuring very highly in our review, are management's focus areas aligned with the current overall market focus on returns? In saying that, we note that some high growth companies in the sector could be held strategically for future growth prospects, rather than current cash returns.
Approximately half of the companies reviewed included cash measures as KPIs, a good indication that management continues to focus on liquidity following the credit crunch and amid increased corporate failures. The most common measures were operating cash flows, cash generated from operations and cash conversion.
21 companies included balance sheet measures other than cash. The most common of these related to working capital measures being debtors days, days sales outstanding and stock turn and seven companies identified net debt. Other balance sheet KPIs identified included creditor days and net assets per share. Only one company included the pension deficit as a KPI; however a total of 34 companies had defined benefit plan obligations on their balance sheets. With defined benefit obligations becoming increasingly onerous and the cause of much investor uncertainty in many companies, we would have expected a greater emphasis by management on these measures.

|
Financing – Caution the Watchword Perhaps due to the conservatism driven by the economic environment, the companies reviewed retained high levels of cash balances relative to debt, with total cash held of £2.9 billion compared to total debt levels of £3.4 billion. This relatively low level of indebtedness was further borne out by the EBITDA to interest expense ratio which was in aggregate 22:1 and adjusting for those with a greater than 50:1 ratio (indicating significantly low gearing or one-off items in EBITDA) the average was 10. Further evidence of the Technology sector's financing conservatism was demonstrated by the net total of £295 million of debt repayments that were made in the year. 44% of companies reviewed made a net debt repayment in the year. |
Non-Financial Measures
Perhaps surpisingly, given the breadth of non-financial KPIs that could be disclosed, 33 companies in our review did not identify any.

Unsurprisingly performance by underlying volume is the most frequently identified non-financial measure with 14 companies including orders, order growth and book to bill ratios. Three companies included contract renewal rates as KPIs. A further seven companies included product and contracts sold which included one company which identified major project completion. This indicates management's strong focus on the drivers of business performance. Despite the Companies Act's reference to environmental and employee related KPIs, only 17% of non-financial KPIs
related to environmental and ethical KPIs which included energy usage, accidents reported and values alignment. With an increased focus politically on the green agenda globally, we would have expected greater emphasis by management.
KPIs which were explicitly employee related such as headcount, length of service and retention/recruitment, attrition, health and safety, employee turnover and satisfaction, made up only 12% of non-financial KPIs and only 3% of all KPIs which were identified. Unsurprisingly Software and Services companies being more labour intensive, showed employee related KPIs making up 28% of their non-financial KPIs and 5% of KPIs overall.
Other non-financial KPIs included customer satisfaction, geographic dispersion, efficiency, market share, number of clients, number of products launched, accuracy of product development schedules and occupancy.
To read this Report in full please click here.
The content of this article is intended to provide a general guide to the subject matter. Specialist advice should be sought about your specific circumstances.

