
Statistics for judicial and court activity in England and Wales have been published by the Ministry of Justice for the year 2010. The report, which was published on 8 July 2011, nearly three months earlier than previous years' reports, indicates a fall in the number of claims being brought across the board.
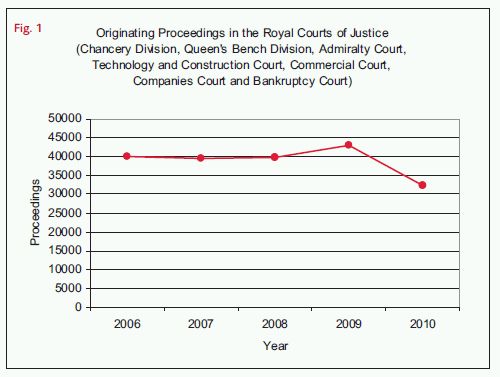
This year's statistics show that the upward trend in the volume of litigation dealt with by the High Court in London in previous years reversed in 2010, with proceedings originating in the Royal Courts of Justice (excluding the family division) falling by a quarter (see Fig. 1). Again, the biggest impact on this figure was the number of originating proceedings in the Bankruptcy and Companies Courts, which accounted for 58 per cent of the decrease, although the trend was followed across all the courts of both the Queen's Bench and Chancery Divisions. However, the report indicates that the figures for the number of Bankruptcy Court proceedings in 2008 and 2009 and the number of Companies Court proceedings in 2009 have been revised downwards, which has had a knock-on effect on the total number of proceedings in 2009 and 2008.
Had these figures not been revised, the fall in the number of proceedings dealt with by the London High Court would have been even more dramatic.
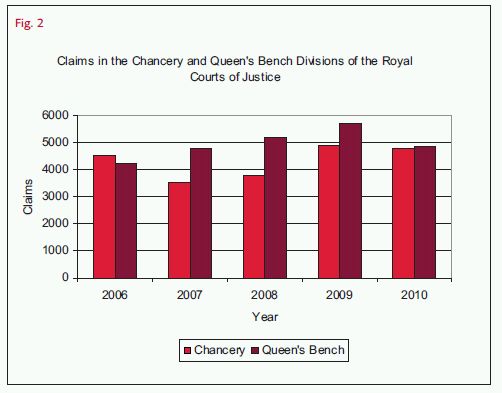
The gap between the number of claims issued in the Chancery and Queen's Bench Divisions of the Royal Courts of Justice almost closed in 2010 (see Fig. 2), with a difference of just 54 claims between them. In the Queen's Bench Division, only the number of debt claims increased in 2010, and there was a surprising 47 per cent fall in the number of defamation claims (see Fig. 3).
This fall can, perhaps, be partially attributed to the introduction of the mandatory defamation costs management pilot, which applies to defamation proceedings issued in London and Manchester on or after 1 October 2009, and which is still continuing.
Meanwhile, in the Chancery Division, the creation of a new category for claims, namely contract claims, has made comparisons difficult. Nevertheless, it is clear that the type of work carried out by the Chancery Division was least affected by the general reduction in the number of claims, reducing as it did by under 2 per cent (see Fig. 4).
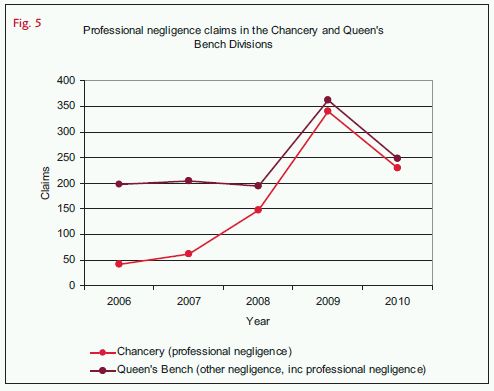
2009 saw a notable increase in the number of professional negligence claims issued in the Chancery Division and the number of "other negligence" claims issued in the Queen's Bench Division, a category which includes professional negligence. In 2010, however, both categories saw an identical fall of 32 per cent, with professional negligence claims in the Chancery Division falling to 230 from 339, and "other negligence" claims in the Queen's Bench Division falling to 247 from 362 (see Fig. 5). It may be that we have seen the peak in the number of claims against professional advisors arising out of the financial crisis. However, the levels of claims still remain significant, and the long limitation periods applicable to these claims mean that exposures created by the downturn may affect professionals for many years to come.
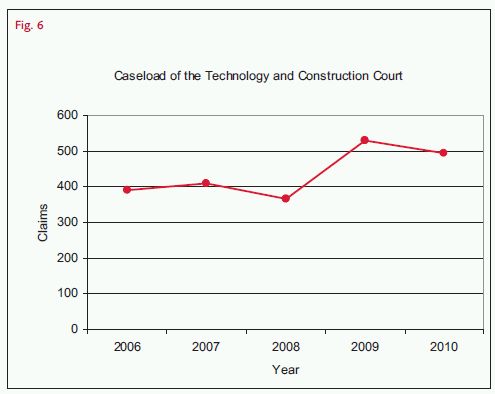
Although dropping slightly in 2010, the number of claims dealt with by the Technology and Construction Court remained high, with 493 claims issued or transferred in 2010, down by just 35 claims from 2009 (see Fig. 6). However, after a spike in 2009, levels of work in the Commercial Court dropped back to 2008 levels (see Fig. 7).
Turning to the appellate courts, the figures from the Supreme Court show that, in its first full year of existence, the highest court of the land remains more likely to allow an appeal than dismiss it. In 2010, the Supreme Court dealt with 46 civil claims from the Court of Appeal. This was an increase on 2009 levels, but still 27 per cent fewer claims than the House of Lords dealt with in 2008 (see Fig. 8). Meanwhile, in the Court of Appeal's civil division, the number of final appeals allowed, dismissed and dismissed by consent, struck out or otherwise disposed of maintained a level trend (see Fig. 9).
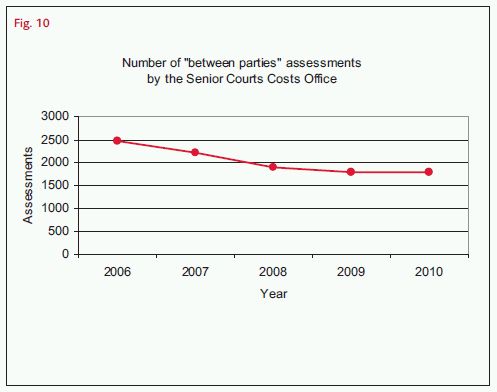
Finally, statistics for the Senior Courts Costs Office (SCCO) show that, unlikely as it may seem, in 2010 the number of "between parties" assessments by the SCCO (ie assessments of bills to determine how much a successful party can recover from their opponent) remained exactly the same as the figure for 2009 (see Fig. 10).
Following the increase in claims dealt with by the London High Court in 2009, it was always going to be interesting to see whether the upward trend would continue. A further big rise was unlikely but a levelling off would have been more in line with expectations than the significant drop which the latest figures reveal. The fall may be due in part to the successful adoption of alternative dispute resolution techniques such as mediation before commencing proceedings, rather than waiting until after litigation has started. The gradual easing of the economic position in 2010 will also have been a factor. However, with trading conditions remaining difficult in many sectors, an uncertain outlook prevailing and the banks continuing to assess their loan books, it will be interesting to see what 2011's figures reveal


The content of this article is intended to provide a general guide to the subject matter. Specialist advice should be sought about your specific circumstances.

