
FOREWORD
Welcome to the 2016 edition of Deloitte's mobile consumer survey.
This year's report will likely mark the end of the smartphone growth era, and the start of its consolidation. A mere nine years after the launch of the first full touchscreen smartphone, adoption is nearing a plateau, at 81 per cent of UK adults, and 91 per cent of 18–44 year olds.
The smartphone user base is approaching an unprecedented peak. No other personal device has had the same commercial and societal impact as the smartphone, and no other current device seems likely to.
While the base may plateau, relentless innovation continues at device and network levels. Devices are likely to incorporate more functionality and get even faster.
Biometric sensors, particularly fingerprint readers (this year's cover image), are likely to see widespread adoption. Over a quarter of smartphones now have a fingerprint reader, of which three quarters are in use.
The majority of phones are now connected to 4G, and cellular networks are getting ever faster, with headline speeds now at over 300 Mbit/s.1 As speeds rise, ever more latent, high bandwidth applications become viable. It is now as easy to read the news on a phone as it is to live stream a breaking news event from a smartphone.
Businesses and consumers are still determining how best to use these devices. For the former, a common dilemma is over whether to use apps or websites. The typical UK user downloads 20 or fewer apps. Our research suggests that apps are not the right approach for every business.
Consumers, who collectively look at their smartphones 0.4 trillion times per year,2 still need to identify how to use their devices in a balanced way, at a level that suits them, their other halves and colleagues. It is the sleek digital Swiss army knife that can be used at every stage of the day (as shown in the centrefold graphic).
How people will use their devices to communicate will be driven by consumers. The traditional voice call has become steadily less popular over the last four years, and usage of email, social networks and instant messaging has risen in tandem.
The smartphone's success has overshadowed the performance of other devices, including tablets. Two thirds of adults in the UK now have access to a tablet, yet this triumph pales compared to uptake of smartphones. Adoption of a wide range of connected devices, including fitness bands, smart home appliances, smart lighting and smart watches appears lacklustre by comparison at under ten per cent.
The era of smartphone growth is drawing to a close; consolidation will be an exciting time.
It's 2016 and there's no place like home, or indeed the home screen of one's smartphone. And in the coming years, the smartphone is likely to further reinforce its position at the centre of tens of millions of UK citizens' lives.
We hope that you find this set of insights useful, and we welcome further conversations based on the content or full data sets.
BETTER LIVING WITH SMARTPHONES
In a mere nine years the smartphone has had a massive impact on UK society. Collectively, UK citizens look at their smartphones over a billion times a day.3
Four out of five adults now have one. Among 18-44 year olds, adoption is higher still at 91 per cent – equivalent to 21 million people.4 For the majority of smartphone owners, it has become their ever-present companion. It is useful and entertaining. It is functional and ostentatious. It enables creativity and consumption. It fosters productivity – and offers distraction.
Smartphones are personal, but their usage impacts on those around them. As with most emerging technologies, consumers will need to learn how best to run their lives with smartphones, as opposed to having their lives run by their devices.
A day in the age of the smartphone
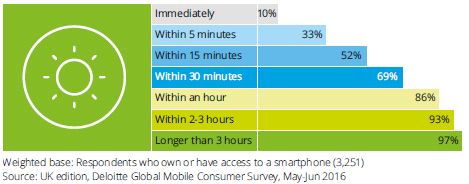
A tenth of smartphone owners instinctively reach for their phones as soon as they wake up – and not just to turn off their alarm. A third reach for their phones within five minutes of waking, and half (equivalent to 23 million UK adults) within a quarter of an hour (see Figure 1).5
Figure 1. Interval between waking up and checking smartphone (%)
Question. Typically how long is the interval between waking up and looking at your phone for the first time?
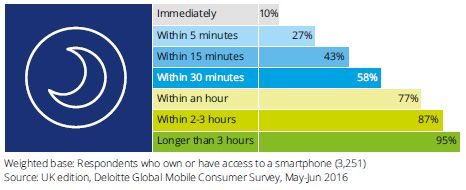
A similar pattern takes place at night. Over half of smartphone owners check their phones within 30 minutes of turning in for the night; a quarter check them five minutes before; and a tenth immediately before (see Figure 2).
Figure 2. Interval between last check of smartphone and preparing to go to sleep (%)
Question. At the end of the day, typically how long is the interval between looking at your phone for the last time and preparing to sleep?
Getting a good night's sleep has benefits for physical and mental wellbeing. Exposure to light, including that from a screen just before going to sleep, can confuse the brain into thinking it is still daytime, and inhibit the process of falling asleep..6 One study of 10,000 16-19 year olds found that their quality of sleep was related to the quantity of time spent in front of a screen before going to bed..7 The study's authors recommended that screens be turned off at least an hour before turning out the lights. According to our research, less than a quarter of smartphone owners leave a sufficient interval.
Those unable to supress the temptation to have one last glance can lessen the impact of the standard blue light emitted by device screens by selecting a night-time mode, which can be set, like an alarm clock, to go on at the same time each day.
When night-time mode is in effect, device screens show warmer, yellower hues instead of blue tones. This can help prepare the body for sleep.
To read this Report in full, please click here.
Footnotes
1. EE LAUNCHES NEXT PHASE OF 4G FOR THE WORLD'S FASTEST SMARTPHONES, EE, 6 September 2016: http://newsroom.ee.co.uk/ee-launches-next-phase-of-4g-for-the-worlds-fastest-smartphones/
2. Calculated as 1.1 billion times a day multipled by 365 days of the year. The options given to this question were: 'Never', 'Under 10 times' 'Between 11 and 25 times', 'Between 26 and 50 times', 'Between 51 and 100 times', 'Between 101 and 200 times', 'Over 200 times' and 'I don't know'. To calculate the average number of times people look at their device, a mid-point has been taken for all the options with the exception of 'Never' where a value of zero has been used and 'Over 200 times' where a value of 250 has been used. Respondents who answered 'I don't know' have been excluded from this calculation. An average has been calculated for each age group and then multiplied with the number of smartphone owners in that age group. A value has been considered for the 14-17 and 75+ age groups.
3. The options given to this question were: 'Never', 'Under 10 times' 'Between 11 and 25 times', 'Between 26 and 50 times', 'Between 51 and 100 times', 'Between 101 and 200 times', 'Over 200 times' and 'I don't know'. To calculate the average number of times people look at their device, a mid-point has been taken for all the options with the exception of 'Never' where a value of zero has been used and 'Over 200 times' where a value of 250 has been used. Respondents who answered 'I don't know' have been excluded from this calculation. An average has been calculated for each age group and then multiplied with the number of smartphone owners in that age group. A value has been considered for the 14-17 and 75+ age groups.
4. Calculated as 91 per cent of 23 million. Based on 18-45 year old population sourced from Population Estimates for UK, England and Wales, Scotland and Northern Ireland: mid-2015. See Population Estimates for UK, England and Wales, Scotland and Northern Ireland: mid-2015, Office for National Statistics, 23 June 2016: http://www.ons.gov.uk/peoplepopulationandcommunity/populationandmigration/populationestimates/bulletins/annualmidyearpopulationestimates/mid2015
5. Calculated as 50 per cent of 45 million. Based on 18-75 year old population sourced from Population Estimates for UK, England and Wales, Scotland and Northern Ireland: mid-2015. See Population Estimates for UK, England and Wales, Scotland and Northern Ireland: mid-2015, Office for National Statistics, 23 June 2016:http://www.ons.gov.uk/peoplepopulationandcommunity/populationandmigration/populationestimates/bulletins/annualmidyearpopulationestimates/mid2015
The content of this article is intended to provide a general guide to the subject matter. Specialist advice should be sought about your specific circumstances.

