
By Dr. Denise Martin, Dr. Stephanie Plancich, and Janeen McIntosh1
Introduction
In wage and hour litigation, current and/or former employees allege unpaid work, including unpaid overtime, failure to provide meals and/or rest breaks, and off-the-clock work. Cases may be brought under state law or under the Federal Fair Labor Standards Act (FLSA). These cases may result in civil settlements or verdicts, as well as in back wages and penalties levied by the Department of Labor (DOL).
In this study, we track trends in civil settlements of wage and hour cases. We found that, in 2012, companies continued to pay substantial amounts to settle lawsuits involving allegations of wage and hour violations. We identified total wage and hour settlement payments of $467 million in 2012, bringing the aggregate amount paid over the past six years to approximately $2.7 billion. A relatively steady number of identified cases settled before trial each year, with 102 in 2012 and a total of 446 over the last six years.
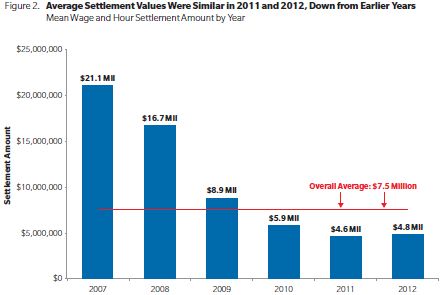
On average, companies paid $4.8 million to resolve a case in 2012, up slightly from the $4.6 million observed in 2011, but lower than the overall average of $7.5 million for the 2007 to 2012 period. The median settlement value for 2012 of $1.7 million was also slightly higher than the $1.6 million median in 2011.
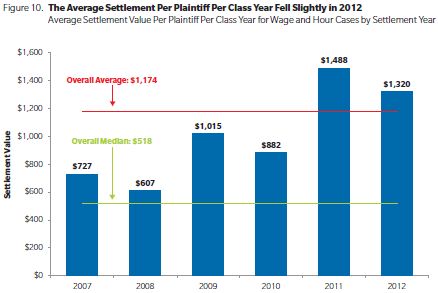
After controlling for the number of plaintiffs in a case and the number of years in the class period, we found a decrease in the average settlement value per plaintiff per class year: the average for 2012 was $1,300, lower than the $1,500 observed in 2011.
We found an increase in the proportion of these settlements that included allegations of minimum wage and overtime violations in 2012, relative to prior years. In 2012, we also found an increase in the proportion of settlement dollars in the health care service industry (27% in 2012 versus only 4% from 2007 – 2011).
This year, we compared our sample of civil wage and hour settlements to concluded actions taken by the DOL's Wage and Hour Compliance division over the past six years. Over that time period, the DOL reported thousands of investigations, of which approximately 75% resulted in a determination of a violation. Employees in a subset of these cases where a violation was found were awarded back wages, and the employers paid a total of $1.63 billion in back wages and penalties.
Comparing our wage and hour settlement data to the DOL data, we found that more than 50% of the companies with a wage and hour settlement between 2007 and 2012 had also been investigated by the Department of Labor's Wage and Hour Compliance division. More than 25% of the companies in our wage and hour settlement database were found by the DOL to have an FLSA violation, and back wages associated with these violations totaling $18.8 million were paid.


Data and Methodology
Our updated data includes 446 settlements for wage and hour cases, obtained from articles published in Law360 between 1 January 2007 and 31 December 2012 and a review of the Seyfarth Shaw annual litigation report for 2007- 2012. When the information available from these sources was incomplete, additional case-specific details were obtained from Factiva. In addition to settlement value, the data extracted includes case-specific information such as industry, allegations, number of plaintiffs, length of class period, and jurisdiction. While this data collection methodology yielded a substantial number of wage and hour settlements, particularly those with large settlement amounts and/or large classes, it is not necessarily comprehensive.2
The DOL's Wage and Hour Compliance Data was obtained from the website http://ogesdw.dol.gov/data_summary.php.


Average Wage and Hour Settlements – Trends per Plaintiff and per Class Period Year
- For 75% of the cases in our database, we are able to determine the number of plaintiffs participating in the settlement; for about 65% we have both the number of plaintiffs and the reported settlement amount.
- The number of cases with over 10,000 plaintiffs has been decreasing over the past five years. Only about 5% of settlements in 2012 were for cases with such large classes.
- On average, the settlement per plaintiff for this subset of cases is $5,800. A small proportion of cases had settlements averaging over $25,000 per plaintiff, which skews the average upward. The median settlement per plaintiff was lower at $2,600.
- Cases with more plaintiffs tend to have higher total settlements but lower settlements per person.
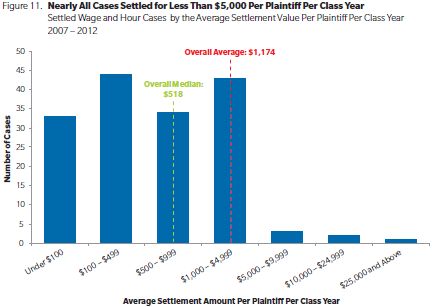
- For about a third of the settlements in our database, we know the number of plaintiffs in the case, the number of years covered by the settlement, and the settlement amount.
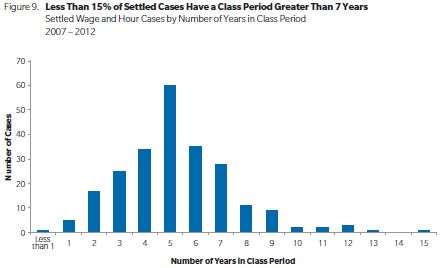
- The median and average duration of a class period in our data was five years. Like cases with more plaintiffs, cases with longer class periods tended to have larger total settlements. However, these cases did not tend to necessarily have higher settlements per class year.
- The vast majority of average settlements were less than $5,000 per plaintiff per class year. The few cases with average settlement amounts per plaintiff per class year above $5,000 were in either the telecommunications/utilities or the financial services/insurance industries, and included allegations of misclassification and overtime.
Case Characteristics
- We identified all the allegations made in the cases in our
settlement database and classified these allegations in the
following categories:3
- Overtime
- Off-the-clock
- Minimum wage violation
- Donning and doffing
- Missed meals and breaks
- Misclassification
- Tip pooling
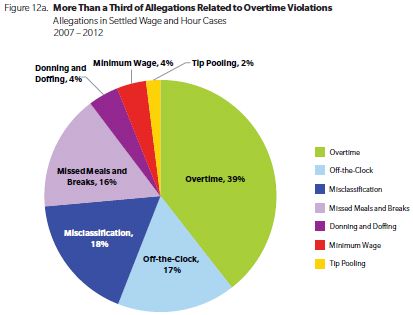
- Figures 12a and 12b show the universe of all allegations related to the settled cases in our database. Many cases had multiple allegations—for example, workers frequently claimed that alleged off-the-clock work caused them to have minimum wage violations. About 60% of the cases had at least two allegations. Approximately 15% of the cases in our data had an allegation of overtime only, while another 56% included an allegation of overtime in addition to one or more other allegations.
- This pattern of allegations has been relatively steady—as in prior years, overtime allegations dominated in 2012. Off-the-clock allegations were slightly down in 2012 compared to earlier years, but minimum wage allegations were slightly up.
- We also identified the industries of the settling defendants and found that the most common industry was financial services/insurance, followed by retail.
- A similar pattern held for total spending, with 31% of settlement dollars paid to workers in the retail industry and approximately 20% of settlement spending paid to employees in the financial services/insurance sector.
- Additionally, the majority of the cases in both the financial services/insurance and retail industries included allegations of overtime. While the second most frequent allegation in the financial services/insurance industry was misclassification, in the retail industry, in addition to allegations of overtime violations, we saw allegations of off-the-clock work and missed meals and breaks.
- In 2012, there was a shift in the total spending pattern, with a big surge in relative spending paid by employers in the health care industry. This increase in spending was driven by one relatively high settlement in the health care sector—almost three times as high as any other settlement in other sectors in 2012—rather than by an increase in the number of health care cases settled or an increase in the settlement amounts paid by employers in this industry.
- The majority of settlement dollars have been paid out in New York and California.


Notable Settlements in 2012
Although none of the 2012 settlements were out of the historical range, a few notable cases had relatively high settlement values.
- Novartis Pharmaceuticals Corp. - $99 million. The case included 7,000 workers who alleged that they were misclassified and denied overtime. This outlier settlement drove up the average settlement value for companies in the health care services industry compared to prior years.
- H&R Block Enterprises, Inc. - $35 million. Plaintiffs asserted that the company had violated California labor laws. The case involved 18,000 employees.
- Prudential Insurance Co. of America - $1.02 million. The average settlement value per plaintiff for the case was $46,000. The case included allegations of off-the-clock work for just 22 employees.
DOL Data Description and Trends
This year for the first time our analysis includes a review of the DOL's Wage and Hour Compliance Action Data. The data spans all concluded actions since 2007 and includes variables such as indicators for whether violations were found, whether the violations were FLSA, and the amount of back wages, if any, agreed to be paid by the employer.
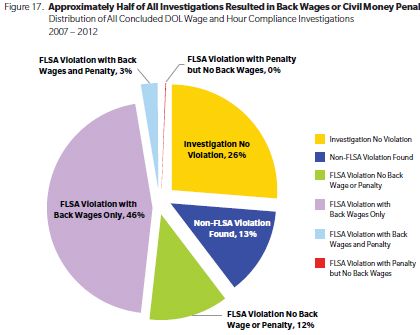
Since 2007, the DOL has completed over 150,000 investigations, of which over 110,000 resulted in findings of violations. Of those, 75% included back wage payments, and 11% included some kind of penalty. Also, over 80% of the cases found to have a violation included an FLSA violation, and 65% included back wage payments in relation to the FLSA violation.
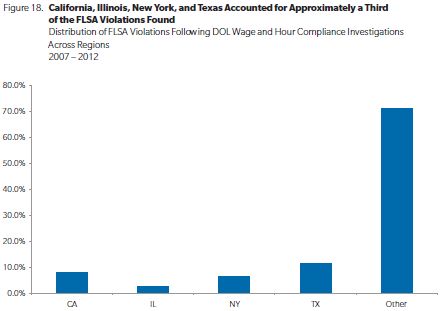
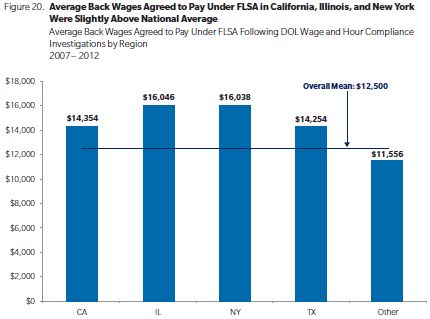
As in our civil case settlement data, California and New York were two of the jurisdictions with the highest level of wage and hour activity—either settlements or investigations.
In the aggregate, back wages paid for cases with DOL wage and hour enforcement violations was $1.55 billion over the six years, with an additional $79.0 million assessed as civil money penalties.

DOL and Wage & Hour Data
Many of the allegations related to FLSA violations are the same as those brought in state court wage and hour civil litigation. To see if there was overlap in the defendants settling civil cases with those found to have FLSA violations by the DOL, we matched our wage and hour settlement database to the DOL's violation list.
Given the available data, it is not possible to do a one-to-one map of each investigation to each settlement. However, we can identify and match the defendant companies in both databases. In other words, starting with our wage and hour settlement data companies, we looked to see if any of these companies were listed in the DOL data during the 2007-2012 period.4
We found that 58% of the defendants in our database with a settled a wage and hour civil case between 2007 - 2012 also had a DOL investigation. Of those, 12% were found to have a non-FLSA related violation and 28% were found to have at least one FLSA violation. This means 60% of the companies with wage and hour settlements either had no investigation or were found to have no violation.
For the defendants with an FLSA violation, 80% paid at least some back wages to employees: 62% of these were for overtime, 17% were for overtime and minimum wage, and 2% were for minimum wage only.


Footnotes
1 We thank Neil Fanaroff and Yikang Li for additional research assistance.
2 Also, due to incomplete information, reported statistics exclude the Wal-Mart Multi-District Litigation settlement in 2008, which resolved 63 wage and hour class action cases for over $600 million.
3 There are a handful of cases with "Other" allegations which were not captured by these categories.
4 This restriction exists because a company may show up multiple times in either database, so there is no definitive way to tie an investigation to a specific settlement. Furthermore, no open or close dates exist in the DOL data, so there is no way to effectively approximate which DOL investigation is related to which settlement.
The content of this article is intended to provide a general guide to the subject matter. Specialist advice should be sought about your specific circumstances.


