
Introduction
In 2009 the Colombian telecommunications regulator—Comisión de Regulación de Comunicaciones ("CRC")—declared Colombian mobile operator Comcel a dominant operator.1 As a result, the CRC imposed asymmetric regulation on Comcel by establishing a retail price cap for its off-net voice calls. The price cap formula requires Comcel to set the off-net price on the basis of its on-net price plus the mobile termination rate ("MTR").2 Only Comcel must abide by the price cap, other operators are exempt. In practice, this forces Comcel to rebalance its retail rates by lowering its off-net prices and/or increasing its on-net prices.3
We examine the economic and consumer impact of the CRC's regulation in 2009.4 In the absence of market failure—which we do not believe is a concern in the Colombian mobile market—the regulation of retail prices lowers economic efficiency. In order to determine the impact of the 2009 dominance regulation, we estimate a demand model of the Colombian mobile market during the period 2005 – 2011 using publicly-available data. The estimated model relates mobile output to price, income, technological changes, changes in consumer tastes, and the imposition of dominance regulation in 2009 through a binary variable. We find that the imposition of dominance regulation in 2009 has made consumers worse off than they would otherwise have been. Specifically, we find that the regulation resulted in a lowering of market output by approximately 5% (equivalent to approximately 11,000 million minutes). Given that the model's estimated own-price elasticity of demand is approximately -0.66, the reduction in market output from regulation results in an effective price increase of approximately 7.5% during the post-dominance period. While consumer benefits increased significantly during the period 2005 – 2011, benefits would have been even greater without the regulation. We find that the change in consumer benefits during the period 2005 – 2011 was approximately USD $900 million. Without the regulation, however, consumer benefits would have been approximately USD $1,000 millions. Thus, we find that the dominance regulation in 2009 lowered benefits to consumers in Colombia by approximately USD $100 million.
We begin this paper with a description of the Colombian mobile market since the late 1990s followed by a discussion on the hypothesized effects of asymmetric regulation on mobile markets. The last section presents our empirical analysis of demand for mobile services in Colombia and the impact of asymmetric regulation.
The Colombian Mobile Market
There are currently three facilities-based mobile operators in Colombia—Comcel, Movistar and Tigo. Comcel and Movistar entered the Colombian mobile market in 1994 and Tigo entered the market in 2003. In addition UFF Movil entered in late 2010 and operates as a Mobile Virtual Network Operator (MVNO) using Tigo's network. UNE-EPM is another entrant into the market and is a publicly owned municipal entity that owns 25% of Tigo. In 2010 UNE-EPM won a tender for mobile spectrum in the 2500MHz – 2690 MHz frequency band suitable for deployment of either mobile WiMAX or Long Term Evolution/4G networks and is the first operator in Colombia building out a 4G network. Finally, Virgin Mobile has received regulatory approval to enter in 2012 as a MVNO.
Churn rates are high in Colombia. In 2010, Colombia's net churn rate stood at 3.6%, as compared to 1.8% for the United States, 2.2% on average in Europe, and 3.0% on average for Latin America (Colombia's churn rates have been higher than the Latin American average since 2007). Furthermore, Comcel's churn rate in 2010 stood between its two major competitors: 3.6% compared to 3.2% for Movistar and 4.6% for Tigo.5
Figure 1 provides information on market share by operator and penetration during the period Q4 Y1998 to Q3 Y2010. Comcel has not always been the larger operator. In fact, Comcel has grown in the marketplace to become the largest provider surpassing Movistar in the second quarter of 2000. Prior to this date and when measured by the number of subscribers, Movistar held more than 50% of the market, whereas on the third quarter of 2010 it held less than 23%.6 The fact that the penetration rate increased from 4.4% to 95.4% during the period indicates that the market as a whole expanded significantly, and along with the high churn rates in this market, it evidences rivalry among market participants.

Figure 2 depicts the number of minutes and the average voice revenue per minute ("ARPM") in nominal and inflation-adjusted real terms7. ARPM plummeted during the period Q1 Y2005 and Q4 Y2008, which further evidences the existence of rivalry in this market.8 During the period, nominal ARPM decreased by 67% while real, inflation-adjusted ARPM decreased by 75%. During the "pre-dominance regulation" period (Q1 Y2005 to Q4 Y2008), the ARPM average decrease was -5.9% per quarter, whereas the "post dominance regulation" period (Q1 Y2009 to Q3 Y2011), the average decrease rate was -1.9% per quarter.9 We tested the hypothesis that the means of these two periods were statistically equal and it was rejected at a 1% significance level which means that prices were falling at a faster rate in the pre-regulation period than during the post-regulation period.

The number of mobile minutes10 in Colombia increased sharply as well during the period. In the first period of 2005 (Q1Y2005), a total of 3.9 billion minutes were consumed, whereas in the third quarter of 2011 (Q3Y2011), the latest quarter for which data are available, minutes consumed had increased to 23.8 billion, a 516% increase equivalent to a quarterly growth rate of 7.2%.
In Figure 1 we observe market share levels that are fairly constant over a recent period (since the mid-2000s) while in Figure 2 we observe significant reductions in price (ARPM) and significant increase in output during the same period. The dynamics of the mobile market in Colombia indicates that relatively high market shares, especially in light of high churn rates and falling prices, do not necessarily entail lack of rivalry. 11
Economic Analysis on Asymmetric Regulation
Previous findings
The empirical literature provides evidence that regulating mobile retail prices harm consumers, especially in markets like Colombia where competition is sufficiently developed. Professor Hausman carried out studies that assessed the effect of regulating mobile prices in the United States during the 80s and the 90s. At that time the public policy in the United States in regard to mobile services was to restrict entry and permit only a duopoly. About half of the states in the United States regulated retail mobile prices and half of the states did not regulate mobile prices. Professor Hausman's research found that states that had mobile price regulation had higher mobile price levels compared to states that did not have it. In particular, Professor Hausman's research indicated that mobile prices in cities with mobile price regulation were approximately 24% higher than those with no regulation, and that regulation alone explained 15 percentage points of this difference whereas other factors only explained 9 percentage points.12
There is a large theoretical literature on the on-net/off-net differential and the impact of regulatory intervention.13 The results in the literature depend on key assumptions regarding the value of the call externality, linear vs. two-part tariffs, marginal costs, and demand elasticities. The results are mixed. Nevertheless, even those authors that identify competition concerns with low on-net prices raise concerns regarding the undesired consequences of government interventions. For example, Hoernig states:14
"[o]ur results show that even in this stylized model it is hard to come to unambiguous conclusions about the effects of regulatory measures...There tends to be a conflict between increasing total welfare and increasing consumer surplus, because interventions that reduce the misallocation resulting from on/off-net differentials tend to reduce the intensity of competition between networks."
Economic analysis
Mobile telecommunications is characterized by significant fixed costs and low marginal costs. In order to fully recover fixed costs, mobile operators cannot price all services at marginal cost and must instead include a "mark-up" above marginal costs for some or all services. As the economic literature demonstrates, the most efficient manner to recover an operator's fixed costs is by taking into account each service's demand characteristic.15 This form of pricing is referred to as "Ramsey" pricing and it is well-known in the economic literature that deviations from Ramsey pricing results in losses in economic efficiency.16
Mobile operators sell hundreds of different types of service plans and packages to consumers including on-net and off-net voice calls, SMS and MMS, mobile data and mobile Internet broadband services. The offering of such disparate plans and packages is efficient as it attempts to segment and cater to individual customer's demand characteristics. Because of the many service offerings catering to disparate customer demand and preferences, consumers purchase more mobile services than they otherwise would have and mobile operators are able to recover their fixed costs from many different offerings in an efficient manner. Because of the many service plans offered by mobile operators, consumers benefit.
The CRC retail price regulation imposes a price cap on Comcel's off-net retail prices. The price cap is shown in equation (1) and is equal to Comcel's on-net retail rate plus the interconnection rate.
![]()
The direct impact of the CRC's regulation on Comcel's mobile prices is to alter Comcel's ability to set optimal prices. Prior to the CRC's regulation, Comcel set off-net and on-net prices based upon respective marginal cost and demand elasticity. If the constraint in equation (1) is not being met then Comcel has several choices: decrease off-net prices, increase on-net prices, or some combination of the two. Any choice, however, results in movements away from more efficient price levels. The profit-maximizing prices for on-net and off-net calls are given by17:

And,

POn and POff are set taking into account marginal costs and demand elasticity of off-net and on-net calls. These prices are set to recover each services respective marginal costs as well as a proportion of fixed costs determined by the demand elasticity. The pricing rules found in equations (2) and (3) ensure that the recovery of fixed costs is done in the most efficient manner possible.
The CRC's price regulation, however, requires that Comcel abide by the following constraint (substitute equation (2) and (3) into (1)):
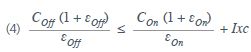
Condition (4) requires Comcel to deviate from setting optimal off-net and on-net prices, as represented by equations (3) and (2), respectively.18 Deviations from profit-maximizing prices will cause losses in economic efficiency, as analysed in detail in the next section. In addition, because Comcel is maximizing its profits pre-regulation and cannot increase its profits under the new vector of prices, Comcel will have to make adjustments in other dimensions such as service quality, investment, innovation and product offering in order to remain as close as possible to pre-regulation profits.
Empirical analysis of CRC dominance regulation
Hypothesis test
We estimate a demand model to investigate the impact on the Colombian mobile market of the CRC's dominance declaration and regulation in 2009. Figure 3 depicts the growth in an index of mobile minutes in Colombia during the period Q1 Y2005 to Q3 Y2011. This Figure shows the evolution of minutes between Q1 Y2005 to Q3 2011. During the "pre-dominance regulation" period, the average growth rate was 10.5% per quarter, whereas "post-dominance regulation," the average growth rate slowed down to 3.8%.19 We tested the hypothesis that the means of these two periods were statistically equal and it was rejected at a 1% significance level.
The econometric analysis developed in this section aims at assessing whether this difference in means in the pre and post periods remains even after controlling for other observable factors that were changing during this period, such as mobile prices (this report uses real average voice revenue per minute as a proxy for mobile prices), income and changes in technology and consumer taste and preferences. The hypothesis we test and what the econometric analysis aims to answer is whether the increase in minutes, although already substantial, would have been even higher had the dominance regulation not been introduced in Colombia in the year 2009.

Econometric analysis
We base our analysis on data from Bank of America - Merrill Lynch's Global Wireless Matrix publications.20 We also relied on Colombian public macroeconomic data for population, inflation, and GDP variables.21 And we used the International Monetary Fund (IMF) "Representative Rates for Selected Currencies" dataset to retrieve Colombia – US dollars exchange rate data.22 We constructed quarterly time series for different variables from the first quarter of 2005 (Q1 Y2005) to the third quarter of 2011 (Q3 Y2011), obtaining a dataset of 27 observations.
We estimate a demand model for mobile minutes in Colombia during the first quarter of 2005 (Q1 Y2005) to the third quarter of 2011 (Q3 Y2011). Minutes are the dependent variable and are modeled to be a function of real average voice revenue per minute and income. This latter variable is constructed by multiplying Colombia's quarterly real GDP per capita times Comcel and Telefonica's subscribers. The model also includes a quarterly "time trend" variable that controls for less observable factors that affect mobile demand such as changes in technology and changes in consumer tastes and preferences. We assume a Cobb-Douglas demand functional form and thus we use logged values for minutes, real average voice revenue per minute and income. Using logarithmic values allows the regression coefficients to be interpreted as elasticities.
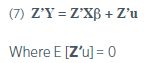
We estimate the following model:
![]()
where Y, the dependent variable, is mobile minutes per quarter, X is an N x k matrix of sample values of the independent variables, β are the k parameters to be estimated and u is a stochastic disturbance. The parameters of the model could be estimated using ordinary least squares (OLS) following the general model where:
![]()
A key requirement for this model to yield unbiased estimates of the true parameters is that E [u | x] = 0, which means that the unobserved factors in the regression function are not related systematically to the observed factors. A concern, however, that arises when estimating demand functions is endogeneity in the independent variables, which entails that E[u | x] ≠ 0. In the particular case of study, real average voice revenue per minute is itself affected by output and thus a change (shock) in u which affects Y would also affect real average voice revenue per minute and thus result in biased coefficient.
A way to surmount this endogeneity problem is using instruments, represented as "Z," to estimate the endogenous variable "real average voice revenue per minute," which should not be correlated with the disturbance term but correlated with ARPM. Therefore, if we pre-multiply equation (6) by the instruments Z we obtain.
We use exchange rate COP – USD and Producer Price Index (or "IPP," according to its Spanish abbreviation) variable data as instruments for the real average voice revenue per minute variable.23 The regression model that we use can be depicted as.
![]()
Where "Q" represents millions of minutes in a given quarter, "P" is real average voice revenue per minute using the exchange rate and IPP as instrumental variables, "Inc" is the average real income of the network users, and "Trend" is a control variable for time effects on the dependent variable. The policy variable of interest in this regression is "Reg," which is turned "on" in the year 2009, when the dominance regulation was introduced in Colombia. The results of this IV regression, as well as the OLS results, are presented on Table 1.25,26
We find that the "price elasticity" of demand IV estimate in the mobile telecommunication market in Colombia is approximately -0.66, which is significant at the 1% level. We find a lower "price elasticity" of approximately -0.59 using OLS. These price elasticity values are similar to the ones estimated in studies made in other countries.27 These results indicate that call volume in Colombia does not change in proportion to variations in prices. Similarly, we find that minutes used increase, although not proportionally, before variations in network subscribers' income ("Inc").28 We also find a positive time trend coefficient indicating that mobile demand is increasing with time, possibly due to changes in technology (service quality) and consumer tastes and preferences.29
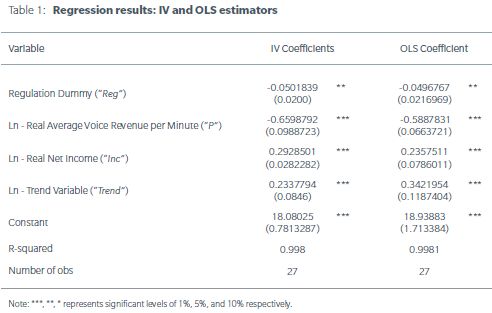
More importantly, we find that the dominance declaration and introduction of asymmetric regulation in 2009 had a negative impact on mobile minutes in Colombia.30 The IV and OLS regression results indicate that minutes decreased approximately 5% in comparison to the pre-dominance period.31 The estimates are statistically significant at a 5% level. This coefficient estimate is virtually identical using both the IV and the OLS estimation techniques. It is worth noting that the dependent variable is measured in millions of minutes, and thus even small percentage decreases are equivalent to considerable reductions in the absolute volume of calls.32
Figure 4 shown below illustrates the impact that the introduction of the dominance regulation had on mobile output in Colombia. The chart depicts the evolution of minutes with and without the regulation, a counterfactual exercise that allows us to assess the impact of this policy change. It can be seen, starting in the first quarter of 2009 (Q1 Y2009), how the two trends start to differ. The total output difference from the first quarter of 2009 (Q1 Y2009) to the third quarter of 2011 (Q3 Y2011) period is approximately 11.5 billion minutes.

Impact on consumer welfare
We now assess the impact that the dominance regulation had on consumers' surplus and welfare in Colombia. Consumer surplus represents the value to consumers from purchasing a product at a price that is below the value the consumer obtains from the product. The econometric analysis developed in this report yields the parameters needed to estimate changes in consumers' welfare in the mobile communication market in Colombia during the first quarter of 2005 (Q1 Y2005) to the third quarter of 2011 (Q3 Y2011) period.33
We find that during the period Q1 Y2005 to Q3 Y2011, consumer benefits increased by USD $900 million. The increase, however, would have been even greater without the regulation. The econometric analysis allows us to estimate a counterfactual change in consumers' welfare had this regulation not been introduced, which is calculated by adding back the negative impact that this policy had on consumers' surplus. To better illustrate this exercise, we calculate cumulative values of changes in consumers' surplus from Q2 Y2005 (where the first change in consumer surplus can be calculated with the available data) to Q3 Y2011.
As it can be seen in Figure 5 below, we constructed two series, one that shows the evolution of this variable with regulation (red bar column), and other that shows it without regulation (blue bar column). Starting in the first quarter of 2009 (Q1 Y2009) with the dominance declaration, the two column bars start to diverge. The cumulative difference in the third quarter of 2011 (Q3 Y2011) was USD $108.4 million. In other words, controlling for other factors, the dominance regulation cost Colombian consumers more than USD $100 million. As a sensitivity test, we used the 95% confidence interval of the dominance regulation dummy variable's coefficient estimate, and we constructed a range of minimum and maximum cumulative difference values for the cost of the dominance regulation on consumers' welfare. The lower confidence interval value yields an estimated cost of approximately USD $24.2 million. On the other hand, the upper confidence interval value yields an estimated cost of approximately USD $189.3 million. Although the confidence interval's values exhibit a considerable variation, the estimated impact remains negative and non-trivial even if the lowest value of the confidence interval is considered.

Conclusions
Regulating markets that are working well distorts competition, lowers efficiency and ultimately makes consumers worse off. The Colombian mobile market has been characterized by strong output growth, decreasing prices, high churn rates, and increasing investment since the early 2000s. Furthermore, the Colombian mobile market exhibits characteristics of a competitive market, such as strong rivalry among established players, low prices, and recent entry by new operators. Like many other countries in the region and around the world, Colombia is transitioning from 2G to 3G technology and is beginning the deployment of 4G technology. The newer technologies will provide improved service quality and lead to the introduction of new products and services. Within this dynamic market context, the enactment of poor regulatory policies risks causing significant negative impacts on this transition and on consumers.
We have estimated that the dominance regulation in 2009 lowered benefits to consumers by approximately USD $108 million, not including possible indirect costs such as impact on service quality, investment, innovation and competition. Additional asymmetric regulations will likely produce more harm to consumers.
Footnotes
1 A finding of dominance does not indicate that the firm engaged in any illegal conduct.
2 The MTR is the price that mobile operators charge other mobile and fixed operators in Colombia to terminate calls on their networks.
3 We have found evidence that Kenya, Namibia, Sri Lanka, Uganda and Paraguay have adopted similar regulation. Slovenia and Turkey have adopted retail regulations on off-net/on-net pricing that applies to all operators in the market. In 2011, the CRC proposed further asymmetric regulation of Comcel's mobile services to take effect in the second quarter of 2012. The CRC proposed a lowering of the price cap ceiling on Comcel's off-net voice calls which would force Comcel to implement further rebalancing of its off-net and on-net prices. In addition, the CRC has proposed asymmetric MTR whereby Comcel's competitors are able to charge roughly twice as much as Comcel to terminate calls on their networks. Combined with the retail price cap formula the asymmetric MTR requires Comcel to change its prices for retail voice services.
4 The complete name in Spanish is Resolución No. 2066 del 2009, "Por medio de la cual se establecen medidas regulatorias aplicables a COMCEL S.A. en el mercado relevante de 'Voz Saliente Móvil', y se dictan otras disposiciones," available at: http://www.crcom.gov.co/index.php?idcategoria=56791&download=Y (accessed June 12, 2012).
5 Bank of America - Merrill Lynch's "Global Wireless Matrix 4Q 2011," pp. 63 and 163.
6 The fixed line telecommunications segment in Colombia differs significantly from the mobile market in terms of concentration. Telmex Colombia, owned by Comcel's parent company America Movil, operates as a MVNO, and as of 2010 it only held approximately 10.5% of the fixed line segment. Other important competitors were the state-owned Empresa de Telecomunicaciones de Bogota (ETB) and UNE-EPM, with shares of approximately 30.7% and 22.7%, respectively. Movistar held 27.9% and Empresas Municipales de Cali 8.2%. Data from TeleGeography GlobalComms Database: Colombia.
7 Average Voice Revenue per Minute includes only Comcel and Movistar, as data for Tigo during the period of analysis was not available.
8 Colombia's ARPM has been one of the lowest in Latin America since 2004. See Bank of America - Merrill Lynch's "Global Wireless Matrix 4Q 2011," p. 81.
9 Growth and decrease rates were calculated using the "Compound Annual Growth Rate" (CAGR). CAGR= (Ending Value / Beginning Value)(1/[t-1]) -1, where "t" is equal to the number of periods.
10 Total minutes were calculated by multiplying the Minutes of Use per average user (MOU) values on Bank of America - Merrill Lynch's Global Wireless reports by the number of Comcel and Telefonica's subscribers for every quarter. These values were used as proxies for total used minutes in Colombia. Minutes reported by the "Ministerio de Tecnologias de la Informacion y las Comunicaciones" tend to be greater than the Bank of America - Merrill Lynch numbers. As a sensitivity test we replicate our analysis in this paper using the Ministerio's minutes and do not find material differences in our conclusion.
11 The market evidence in Colombia is consistent with the economic literature that recognizes that high market share is not necessarily equivalent to market power and ability to charge high prices. See Motta, M. (2004), Competition Policy Theory and Practice, Cambridge University Press, New York, NY.
12 Hausman, J. (2003), "Mobile Telephone," Cave, M. et al., The Handbook of Telecommunications Economics, Vol. 1, Elsevier, p. 30.
13 See for example Harbord and Pagnozzi (2010), Hoernig (2007), and Haucap and Heimeshoff (2011).
14 Hoernig, S., (2008) "Tariff-Mediated Network Externalities: Is Regulatory Intervention Any Good?" The Centre for Economic Policy Research, Discussion Paper No. 6866, p. 18.
15 Ramsey, F. (1927), "A Contribution to the Theory of Taxation," The Economic Journal, Vol. 37, No. 145. (Mar., 1927), pp. 47-61.
16 The exception is when there is a market failure and Ramsey prices reflect monopoly profits. In that case the regulator can determine a competitive return on the firm's profits and use Ramsey prices to determine optimal mark-ups within the profit constraint. Alternatively, a price cap can be established that permits a regulated firm to change prices in a manner consistent with competitive markets, by limiting changes in prices to changes in input costs minus changes in total factor productivity. For the reasons discussed in this paper, however, we do not believe there is market failure in the Colombian mobile market.
17 Derived from maximizing the following profit function: Π = P(q) * q - C(q). For any firm facing a downward sloping demand curve the above function can be used to derive the Lerner index:
![]()
where εOn is the own-price elasticity of demand for on-net calls. Solving for POn results in equation (2).
18 Equation (4) requires Comcel to relate off-net (on-net) prices to marginal cost and demand elasticity of on-net (off-net) calls plus the interconnection rate whereas optimal off-net (on-net) prices are related only to the marginal cost and demand elasticity of off-net (on-net) calls.
19 The "Compound Annual Growth Rate" (CAGR) formula was used to calculate these growth rates.
20 The reports used were Global Wireless Matrix 4Q Y2006, 2Q Y 2009, 3Q Y2011, and 4Q Y2011.
21 We obtained macroeconomic data from the "Departamento Administrativo Nacional de Estadística" (DANE). Its website can be accessed through the following link: http://www.dane.gov.co (last accessed June 12, 2012).
22 Colombia peso's currency code is COP and the US dollar currency code is USD. We obtained quarterly exchange rate COP – USD estimates by averaging the last day of available exchange rate data for every month. Data obtained online from the IMF's website: http://www.imf.org/external/np/fin/data/param_rms_mth.aspx (last accessed June 12, 2012).
23 We need to trace out (i.e., "identify") the demand curve and we use two proxies for costs: the IPP and exchange rate to accomplish this. Mobile telecommunications is capital intensive with equipment imported from abroad and thus changes in the exchange rate affect mobile telecommunications costs. The IPP also should be correlated with mobile telecommunications costs. As these variables change we observe shits in the supply of mobile telecommunications in Colombia which in turn help "identify" the underlying demand curve.
24 Our modeling work comprises an empirical attempt to estimate the demand for mobile telecommunication services in Colombia. It could be described then as a reduced form model, as structural models rely heavily on theoretical assumptions and mathematical statements about how variables affect each other. Empirical estimation of mobile demand models is not foreign to reduced form models, since they have been used extensively in the literature. See for example Lee & Lee (2006) and Garbacz and Thompson (2007). Both, structural and reduced form models exhibit strengths and limitations, and there is no consensus on a particular type of model dominating the other.
25 The estimates from the model in Table 1 are obtained with heteroskedasticity and autocorrelation-consistent estimators. We use the "ivregress" command in Stata and the generalized method of moments estimator. Heteroskedasticity refers to instances when the disturbance term does not have a uniform variance while autocorrelation refers to instances when the disturbance terms are correlated. We performed a Durbin-Wu-Hausman test for endogeneity in the regressor "real price" or "real average voice revenue per minute" which failed to reject the null hypothesis that this regressor is exogenous. However, we adopt a conservative approach and use the IV estimates.
26 We are assuming that the variable dominance regulation is exogenous. We relaxed this assumption and treated this variable as endogenous. We then used Comcel's subscribers share as an instrument for the dominance regulation variable. We found that the dominance regulation IV coefficient estimate was negative and statistically significant. Furthermore, this IV coefficient estimate suggested a higher magnitude of the dominance regulation's impact, or "-0.1860." All other variables' coefficient estimates remained with the expected signs and statistical significance, with the exception of real income, which lacked statistical significance.
27 See for example Lee and Lee (2006) where they estimate price elasticities between -0.482 to -0.941 in South Korea.
28 We note that we are approximating the consumer surplus value obtained under our non-compensated demand model and that that would be obtained under a compensated (Hicksian) demand model. Although statistically significant, the income effect is of lesser importance when compared to the other variable's coefficient estimates in our model. Thus, we argue that our results provide a sound approximation of actual consumer surplus (See Willig, 1976).
29 The use of aggregated country data like the one employ in this study, as opposed to individual consumption data, might cause imprecisions in estimating regression coefficients. However, empirical studies that rely on public data resort to aggregated country data usually because of privacy restrictions that impede the use of more detailed information. Furthermore, numerous empirical studies addressing topics similar to the ones analyzed in this paper are produced annually using data collected by the "International Telecommunication Union," which relies exclusively on country-level data.
30 The coefficient is estimated precisely despite the sample's relatively small size of 27 observations. The recent enactment of this dominance declaration in Colombia restrained us from having a bigger sample with post-policy market data.
31 The pre-dominance period begins in Q1 Y2005 and goes to Q4 Y2008. The post-regulation period then goes from Q1 Y2009 to Q3 2011. The CRC dominance declaration was issued in the first quarter of 2009 although the proceedings and market investigations began in 2007 and were on-going leading up to first quarter of 2009. We select the first quarter of 2009 as the starting date of post dominance period.
32 We also ran regressions using data from the Colombian "Ministerio de Tecnologías de la Información y las Comunicaciones" which had similar subscribers' values but had almost a double value for the minutes' variable. We found that the regulation dummy was still statistically significant at the 5% level and its coefficient was -0.04417. The price elasticity of demand using this data source was virtually identical to the value obtained using exclusively Bank of America - Merrill Lynch data, or -0.6739. Data limitations impeded us to include wireline prices as an independent variable to control for potential competition stemming from the fixed line sector. Some studies have included fixed line prices as a control variable and have found it to be statistically significant (Garbacz and Thompson, 2007). However, some other authors have estimated widely-cited mobile price elasticities without including fixed line prices in their models (Hausman, 1997).
33 If we assume a log – log functional demand form, the change in consumers' surplus can be depicted as:
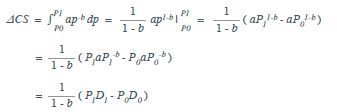
It is worth noting that the preceding sign of this formula must be adjusted accordingly if the analysis focuses on price increases.
The content of this article is intended to provide a general guide to the subject matter. Specialist advice should be sought about your specific circumstances.

