
On 2 April 2009, the US Supreme Court ruled in Entergy Corporation et al. v. Riverkeeper, Inc. that the US Environmental Protection Agency (EPA) may use cost-benefit analysis in setting standards and issuing permits under Section 316(b) of the Clean Water Act, overturning a 2007 decision by the Court of Appeals for the Second Circuit. This section of the Clean Water Act directs EPA to require large power plants and other relevant facilities to install the Best Technology Available (BTA) for minimizing adverse environmental impacts associated with cooling water intake structures. These facilities often process millions of gallons of water per day, which leads to fish losses when fish and other aquatic organisms are trapped against intake screens ("impingement") or pulled into the cooling system ("entrainment").
The major objective of this paper is to explain the methods that environmental economists—working in conjunction with biologists and engineers—have developed to provide reliable assessments of costs and benefits in individual 316(b) permit cases.1 We begin with a discussion of the significance of the Supreme Court's ruling. The Supreme Court held that EPA may—not must—use cost-benefit analysis in making 316(b) determinations. Thus, it is important to demonstrate to EPA's new leadership and to state regulators that site-specific cost-benefit analysis can be implemented effectively and that it should be an important element of the 316(b) decision-making process, as it was before the 2007 Second Circuit ruling.
Significance Of The Supreme Court's Ruling
The Supreme Court's ruling is an important victory for economic and environmental rationality.2 It overturns a 2007 decision (referred to as Riverkeeper II) by the Court of Appeals for the Second Circuit that found that the Clean Water Act did not allow EPA to compare costs and benefits in deciding on BTA. The Court of Appeals found that costs could be considered only in the following conditions: (1) the costs were so high that they could not be "reasonably borne" by industry; or (2) if two technologies achieved the same level of fish protection, the less expensive alternative could be chosen. Otherwise EPA was required to select the technology that provided the most fish protection, even if was far more expensive and had few incremental benefits compared to other alternatives.
Prior to the Second Circuit decision, EPA and the state agencies that had been delegated to issue permits had compared benefits and costs in deciding on BTA technology for particular sites, with technologies not chosen as BTA if their costs were "wholly disproportionate" to their benefits. Under rules promulgated by EPA for existing sources (the so-called Phase II rules), EPA had changed the criteria for site-specific BTA to exclude technologies whose costs were "significantly greater" than their benefits; it was this element of the EPA regulation that was rejected by the Second Circuit in Riverkeeper II, the decision the Supreme Court annulled.
The potential societal gains from the Supreme Court's ruling are substantial, assuming EPA and the States return to comparing costs and benefits in setting 316(b) permit requirements. The most effective technology (usually closed-cycle cooling towers) typically costs hundreds of millions of dollars per plant. Moreover, retrofitting a cooling tower reduces net generation from the plant in two ways: (1) the temporary plant shutdown required in the retrofit process means the facility is not producing electricity and its capacity is not available to meet reliability needs; and (2) the cooling tower reduces the efficiency of the plant and requires electricity on its own, leading to ongoing reductions in generation and capacity. Replacing the lost electricity generation and capacity can drive overall costs above $1 billion in some cases. In addition, particularly for nuclear plants, lost output has negative impacts on climate change and air pollution, because lost output would be made up in large part by fossil fuel-fired plants (coal or gas) that emit carbon dioxide (CO2) and conventional pollutants such as sulfur dioxide (SO2) and nitrogen oxides (NOx).
The Supreme Court decision allows EPA and the states to use cost-benefit analysis to help set site-specific 316(b) requirements for individual power plants. The extent to which cost-benefit analysis will actually be used depends in part on confidence that the method is sound when applied in these cases. Fortunately, economists have developed methodologies that provide comprehensive and reliable 316(b) cost-benefit assessments, including assessments of the implications of uncertainties in some of the underlying parameters. In this paper, we summarize the methods that NERA Economic Consulting has developed and applied in numerous Section 316(b) cases over the past decade.3
Overview Of Cost-Benefit Analysis For Fish Protection
Cost-benefit analysis is a well-established methodology for providing information to decision-makers faced with the task of determining whether a project should be undertaken and, if so, at what scale of activity. The approach involves systematic enumeration of costs and benefits that would accrue to members of society if a particular action were undertaken. The basic rationale for undertaking a social cost-benefit analysis of a particular decision—such as whether to require additional fish-protection technologies at a power plant—is to help put society's resources to their most valuable uses. In choosing among alternatives, the basic cost-benefit principle is to select the alternative that produces the greatest net benefits (i.e., benefits minus costs).
Every president since Jimmy Carter has required that agencies estimate the costs and benefits of major rules for review by the Office of Management and Budget (OMB). As part of that review process, OMB has developed guidelines for conducting cost-benefit analysis (OMB 2003). EPA also has issued its own guidance for such analyses, most recently in 2000 in its Guidelines for Preparing Economic Analyses (EPA 2000). In developing the Phase II regulations under Section 316(b), EPA issued various case studies evaluating the costs and benefits of alternative technologies to protect fish (EPA 2004).4
Figure 1: General Steps In Cost-Benefit Analysis

Figure 1 outlines the general steps in performing a cost-benefit analysis of alternatives to reduce fish losses at a given facility. The steps involve integration of technical, scientific, and economic information. Indeed, we emphasize that sound 316(b) cost-benefit analyses require a collaboration of biologists, engineers, and economists.
Identifying Relevant Technology and Operational Alternatives
Any sound cost-benefit analysis must begin with identification of the alternatives to be evaluated. Most existing power plants and other affected facilities use once-through cooling systems, whereby water is withdrawn from a body of water (e.g., river, lake, or ocean), used to cool the facility, and then discharged back to the water body. Fish losses can result from two general phenomena:
- impingement occurs when fish (generally small species or juveniles of larger species) are trapped against intake screens, and some do not survive.
- entrainment occurs when eggs or larvae are sucked into the plant's cooling system, where they may be lost as a result of thermal shock or abrasion.
Entrainment typically makes up a larger fraction of total losses than impingement, although the specific results depend upon the facility and the species.
A range of technologies and operating procedures can reduce impingement and entrainment. One general approach that addresses both impingement and entrainment is to reduce the amount of water taken in by the plant. Converting the plant to closed-cycle cooling—that is, using cooling towers that allow cooling water to be recycled to cool the plant—is generally regarded as the technology achieving the highest level of control—with reductions of 90 percent or more from baseline levels possible—but it also is typically the most costly option. Smaller reductions in flow can be achieved with variable speed pumps that reduce the flow of cooling water during colder weather, when less water is needed, and during periods when fish losses are likely to be greatest (e.g., spawning periods). Scheduling maintenance and refueling outages for periods of high potential fish losses also can provide gains. To specifically address impingement, various types of screens and other devices (e.g., sound and light sources) can reduce mortality.
Many of the alternatives can be operated at various levels; e.g., variable speed pumps can be operated to reduce flows to varying degrees, or used only at certain times. Various combinations of technologies and operational measures also are often feasible.
Economists conducting a cost-benefit analysis work with engineers and fishery biologists to identify a range of technically feasible and realistic alternatives for evaluation, including variations in intensity and combinations of measures as appropriate. Some technologies might not be technically feasible at a given plant and these can be eliminated from the cost-benefit analysis.
Developing Sound Cost Estimates
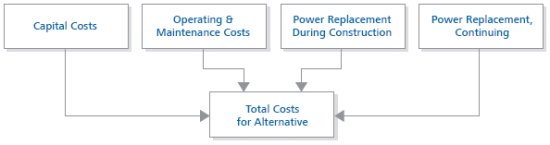
Figure 2 summarizes four general categories of costs that are typically relevant to each regulatory alternative. The costs include up-front capital costs for construction and purchase of equipment plus ongoing operation and maintenance costs. These two types of costs generally are estimated in the first instance by engineering firms based on their assessment of the physical requirements for a particular alternative.
In addition to capital and operating and maintenance costs, as noted above, some alternatives reduce electricity generated by the plant, and that lost output is valued based on the costs of replacing the generation and capacity. Finally, in some cases, control options also entail some environmental costs, particularly those associated with changes in air emissions. We focus here on the estimation of costs of replacement power and consideration of potential environmental costs.
Figure 2: General Categories Of Potential Costs
The Costs Of Power Replacement
Lost power output and capacity may be a one-time event resulting from the need to shut down the plant during some portion of the construction period. In addition, net output also may be affected on an ongoing basis by changes in the electricity required by equipment or reductions in gross output associated, for example, with lower cooling water flows that raise operating temperatures and reduce the efficiency of generation. Lost output must be made up by increased generation at other facilities that have higher marginal operating costs. The types of plants affected by Section 316(b) often provide base load power—i.e., they have low marginal operating costs and hence run as much as possible. The cost of replacement power varies with time of year and time of day, with the highest costs during peak demand periods when even high-cost plants must operate to meet demand. As a result, it is important to specify what time of year a construction outage would be most likely to occur. Often it is necessary to model the operation of the regional electrical system to predict which types of plants would provide replacement power in future years.
The net cost of replacement power is the difference between the marginal costs of running those other plants more intensively and the savings (if any) from reducing output from the plant affected by 316(b). Depending on the nature of the technological alternative, replacement power costs can constitute a very large fraction of total costs. In a recent project, for example, we found that replacement power represented about 97 percent of the cost of one option. In contrast, in another application we found that replacement power accounted for only about one-quarter of total costs. Some technologies have little or no replacement power costs.
Environmental Costs
Air emissions from replacement power are the primary source of environmental costs. If air emissions, such as SO2 and, eventually, CO2, are subject to a cap-and-trade system, the market value of the allowances associated with those emissions provides the appropriate cost measure. For other pollutants, estimates of marginal damages can be used. There also may be other types of potential external effects, such as aesthetic effects associated with tall cooling towers. For the most part such effects are very difficult to quantify, but it is important to list them for completeness.
Developing Complete Benefit Estimates
It is important to develop comprehensive estimates of the likely benefits of the various 316(b) alternatives. The EPA Guidelines provide a summary of the benefit categories relevant to an assessment of ecological benefits, the broad category relevant to Section 316(b) analyses. Figure 3, reproduced from the Guidelines, provides a way of organizing the relevant benefit categories based on how they are experienced. The figure divides ecological benefits into two major categories: use benefits and non-use benefits:
- Use benefits are those associated with actual use of the resource—such as fishing or various water-related activities. Use benefits can be further subdivided into direct and indirect benefits. Indirect benefits and direct benefits may be classified as market or non-market.
- Non-use benefits, in contrast, accrue to individuals who do not use the resource either directly or indirectly, but nonetheless place a value on preventing its impairment.
Figure 3: Potentially Relevant Benefit Categories

Use Benefits From Increased Fish Catches
The primary benefit from Section 316(b) controls is to reduce fish mortality. The primary use value that members of society receive from reduced fish mortality is increased fish catches. In the "direct" category, some species of fish are caught commercially ("market" effect) or recreationally ("non-market" effect). In the "indirect" category, other species are not caught, but rather serve as forage for species that are valued commercially or recreationally; it is important to include the benefits from increased numbers of forage fish in the total benefits.
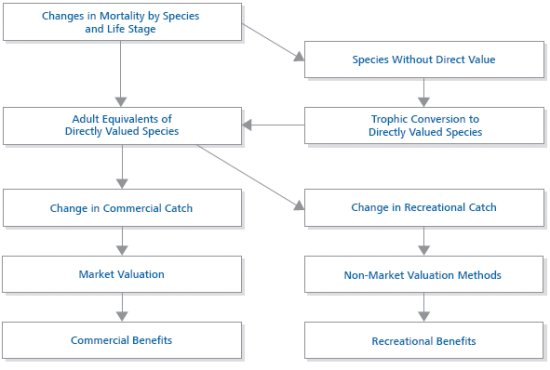
Figure 4 summarizes the steps involved in valuing increased fish catches. The process starts with estimates of the reductions in fish mortality for a given technology, broken down by species and life stage. For species that are caught commercially or recreationally, the next step is for fisheries biologists to estimate how losses at each life stage translate to adult-equivalent fish, accounting for the fact that at each life stage, only a fraction survive to the next stage. Thus, for example, out of hundreds of thousands of eggs, only one may survive to adulthood. These biological calculations are critical to develop sensible benefit estimates, because it is increases in adult-equivalent fish that lead to benefits to commercial and recreational anglers. For species that are not caught commercially or recreationally, the usual approach is for biologists to use trophic conversion factors to account for the fact that more forage leads to more potential commercial and recreational fish catch. The final step before valuation is to estimate what fractions of adult-equivalent fish are caught and how that catch is divided between commercial and recreational fisheries.
Figure 4: Summary Of Steps In Calculating Monetized Benefits Associated With Reduced Fish Mortality
For changes in commercial catch, benefits are equal to the increase in producers' surplus (economic rents to fishermen) plus any increase in consumers' surplus if prices fall as a result of increased catch. In general, the change in catch due to 316(b) controls is too small relative to the relevant market for prices to fall, so the primary question is the extent to which fishermen are better off. Conceptually, this potential gain can be thought of as increased revenues minus increased costs. These costs include the incremental cost of catching more fish. However, because of the well-known "tragedy of the commons," in many fisheries the ultimate effect of increased catch rates will be an expansion of fishing effort—both by existing fishermen and by new entrants—that eliminates any increased rents to fishermen. In some cases commercial fishing benefits have been adjusted to reflect these factors, but it is common to use an upper bound estimate based solely on the increased revenues received by commercial fishermen, without accounting for any increases in costs.
Valuing increases in recreational catches is more complicated, because there are no directly observable market prices for recreational catch. It is clear that recreational fishermen value the fishing experience and, indeed, often spend far more on fishing equipment and supplies than it would cost to buy the fish in the market. Economists have developed various methods for estimating the value that fishermen receive from additional catch and how the value changes at different overall catch rates. Methods based on travel costs are generally considered the most reliable. Such studies gather data on the characteristics (including catch rate) of different fishing destinations and how often fishermen from different areas visit each of those destinations. Fishermen implicitly reveal how much they value different attributes by their willingness to incur higher travel costs to reach destinations with those attributes. Using statistical techniques, the dollar values of these attributes (including catch rates) can be estimated.
Many such studies have been conducted by economic researchers in universities and other institutions. Cost-benefit studies conducted for individual plants subject to possible Section 316(b) requirements generally use benefit transfer methods to adjust estimates in the literature to the case at hand. In its simplest form, benefits transfer consists of identifying studies that are relevant in terms of types of locations (e.g., ocean, lakes, or rivers) and groups of species and then computing some sort of average value, often supplemented by sensitivity analyses using a range of values from the selected studies. More sophisticated approaches rely on "meta analysis" statistical techniques that in effect use the results of different studies to estimate value functions based on different characteristics of the studies and study areas.
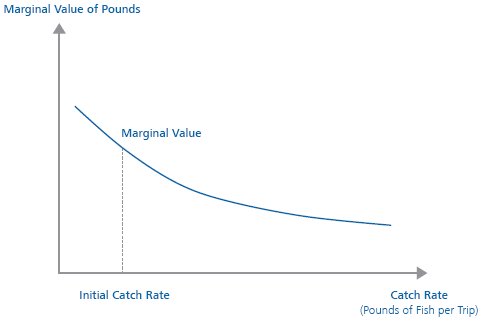
For Section 316(b) studies, the key coefficients are those for measures of catch (such as number of fish or pounds caught per day for a given group of species). These functions often show that as catch rates rise, the value of catching an additional "unit" (e.g., pound of fish) declines; i.e., the marginal value of increasing catch by one pound per day is higher if the catch rate is lower, as shown in Figure 5. Typically, the estimated values per pound for recreational catches are many times higher than for those caught commercially. The benefits analysis must account for fish caught and released as well for those harvested.
NERA has developed a sophisticated meta analysis methodology based upon hundreds of individual studies. This meta analysis model allows us to evaluate the value of fisheries benefits at an individual facility based upon results from a large number of individual studies.
Figure 5: Calculation Of Marginal Value Per Pound Of Increased Catch
Other Potential Use Benefits
In addition to fishing, EPA has identified a variety of other use benefits that may be relevant in some Section 316(b) cases. Some of these categories are captured by the fishing-related measures. Many of these are in effect subcategories of commercial or recreational fishing—e.g., commercial bait, commercial and recreational shellfishing, and subsistence fishing. Others, such as food chain support, are addressed by an analysis of forage species. EPA also has identified various potential use values that are not addressed by analyses of commercial and recreational fishing. Such benefits include non-fishing activities (such as bird watching, viewing, or boating). Typically these other benefits cannot be quantified reliably but they can be evaluated on a qualitative basis, which is important for completeness. In most cases, they can be shown not to be relevant to the kinds of modest changes in fish populations generally found in Section 316(b) cases.
Non-Use Benefits
Non-use benefits are benefits that are not associated with any direct use by either individuals or society. These benefits arise if individuals value the change in an ecological resource without the prospect of using the resource or enjoying the option to use it in the future. The classic example of a non-use value is that many individuals may be willing to pay to preserve the Grand Canyon from being dammed even though they have never visited it and do not expect to do so in the future. Unfortunately, the only way to estimate non-use values is to use stated preference methods that involve surveying individuals and eliciting their preferences directly, rather than inferring those values from actual behavior. Such methods are expensive and difficult to apply well.
Recognizing these problems, EPA's Phase II rules for Section 316(b) cost-benefit analyses provide criteria for determining whether potential non-use benefits are likely to be significant. The Phase II rules recommend that studies consider the "magnitude and character of ecological impacts implied by the results of the impingement and entrainment mortality study and any other relevant information" (69 FR 41648). They suggest considering whether substantial harm is done to one of the following:
- a threatened or endangered species;
- the sustainability of populations of important species of fish, shellfish, or wildlife; or
- the maintenance of community structure and function in a facility's water body or watershed (69 FR 41648).
Working with biologists, we have used these criteria in developing our detailed assessments of the relevance of non-use benefits in individual cases.
Cost-Benefit Comparisons and Uncertainty Analysis
The standard criterion in cost-benefit analysis is to choose the alternative that maximizes net benefits (benefits minus costs). Because benefit and cost streams rarely are constant across time, they must be put in terms of their present value—discounted—before net benefits are computed. Recognizing that the status quo, by definition, has zero net benefits (because all benefits and costs are measured relative to the status quo), alternatives with costs that exceed benefits are rejected based upon the standard cost-benefit criterion. If there are multiple alternatives with positive net benefits, then the one with the largest net benefits should be chosen. This requires comparing incremental benefits and costs of moving to more stringent alternatives. Thus, even if the most stringent alternative has positive net benefits, it should not be chosen if its incremental costs (relative to a less stringent alternative) exceed its incremental benefits.
The analysis should not stop at this point, however, because the quantification of benefits and costs is rarely complete, and often there is substantial uncertainty about the quantitative estimates. As a result, it is important to conduct both a qualitative assessment of unquantified factors and to provide a quantitative assessment of uncertainties.
Assessment Of Unquantified Factors
In evaluating the quantitative results, it is useful to step back and to consider whether costs or benefits that were not quantified are likely to be large enough to reverse tentative conclusions based on the quantified effects. In some cases, it may be clear that quantifying the effect would reinforce the tentative conclusion. For example, if net benefits are positive, taking into account an omitted benefit would increase already positive net benefits. Conversely, if net benefits are negative, then quantifying an omitted cost would make the alternative that much less attractive. In other cases, however, it will be necessary to reach some judgment about the likely magnitude of the unquantified cost or benefit relative to the quantified net benefits.
Uncertainty Analysis
In most cost-benefit analyses there are uncertainties about various elements of the quantitative results. These uncertainties generally come from several sources, including the biological and engineering estimates that provide many of the inputs to the analysis as well as from the economic analysis itself. Such uncertainties are inevitable, as the EPA Guidelines recognize: "[t]he issue for the analyst is not how to avoid uncertainty, but how to account for it and present useful conclusions to those making policy decisions" (EPA 2000, p. 27).
At a minimum, it is important to perform sensitivity analyses that vary the values of key parameters over plausible ranges to see their impacts on results. Such analyses are helpful, but have some important limitations: (1) the number of sensitivity analyses can easily become unwieldy, especially if they include varying the values of multiple parameters simultaneously, and (2) it can be hard to interpret the results when some sensitivity analyses point to one conclusion while others point in a different one.
Monte Carlo analysis goes the next step, generating not just a range of possible outcomes, but also a formalized mechanism for estimating the likelihoods of different outcomes. It requires assigning probabilities to alternative assumptions and parameter values. Each trial of a Monte Carlo analysis involves using the computer to sample from each of the probability distributions of parameter values, and then computing the resulting net benefits. Typically, thousands of trials are run, from which a probability distribution of the outcomes is constructed. Figure 6 presents illustrative results for a hypothetical analysis in the form of a cumulative density function for a particular control option. (Similar distributions are generated for alternative control options.) The horizontal axis is net benefits and the vertical axis gives the probability (based on the Monte Carlo runs) that net benefits will be less than or equal to the value on the horizontal axis. In this example, the 50th percentile is about -$80 million; i.e., it is equally likely that the value is above or below that amount. In some of the runs there were positive net benefits, but they were relatively few in number; in this illustrative example, there is only about a 4 percent probability that the alternative will yield net benefits greater than zero. Thus, in this example, not only is the most likely estimate of net benefits negative, there is only a small chance that net benefits will be positive.
Figure 6: Illustrative Cumulative Distribution From A Monte Carlo Analysis

Concluding Remarks
The Supreme Court's recent decision in Entergy Corp. et al. v. Riverkeeper, Inc. allows EPA and state agencies to use cost-benefit analysis in deciding what controls to require for fish protection at power plants covered by Section 316(b) of the Clean Water Act. EPA and the states had been using this authority for 30 years before the 2007 Riverkeeper II decision, with comparisons of costs and benefits one of the criteria for selecting BTA technologies. In light of the methodologies and data that economists, engineers and biologists have developed to produce sound estimates of costs and benefits, EPA and the states should feel confident that cost-benefit analysis can continue to clarify what is at stake in 316(b) decisions and assist in the development of sound decisions. Indeed, in these difficult economic times, it is particularly important that sound decisions be made and that we get the "biggest bang for the buck" from dollars spent to improve environmental quality.
Footnotes
1. This paper builds upon Harrison and Haxthausen 2003 as well as on the authors' experience with numerous cost-benefit assessments related to 316(b) permit cases.
2. Two of the authors (Dr. Harrison and Dr. Nichols) were among 33 economists who submitted an amici curiae brief to the Supreme Court supporting the use of cost-benefit analysis in implementing 316(b) requirements. See Brief of Amici Curiae 2008.
3. NERA has extensive experience in developing 316(b) cost-benefit assessments, having prepared cost-benefit analyses for numerous major electricity generating facilities on the Atlantic coast, Hudson River and Great Lakes. We believe that these cost-benefit analyses represent the bulk of the full 316(b) cost-benefit studies that have been performed. We have presented the results of these studies to various state and federal regulators. In addition, we have assisted companies and trade associations in the evaluation of 316(b) regulations proposed by EPA and presented our findings to senior government officials.
4. These regulations (suspended after Riverkeeper II) implemented Section 316(b) for existing power plants and other major facilities.
The content of this article is intended to provide a general guide to the subject matter. Specialist advice should be sought about your specific circumstances.

