
The Numbers:
Set forth below are analysis and commentary regarding the information reported in the various tables throughout this issue of Venture Perspectives.
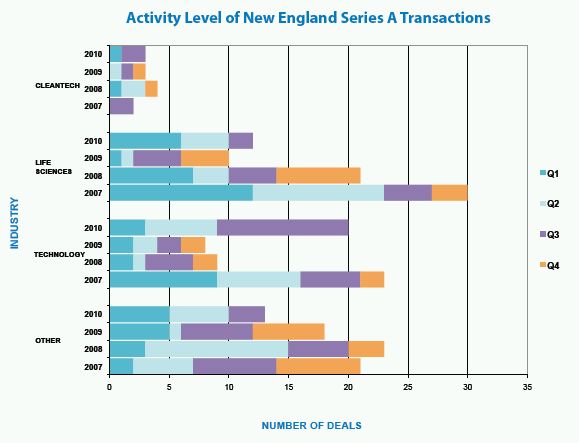
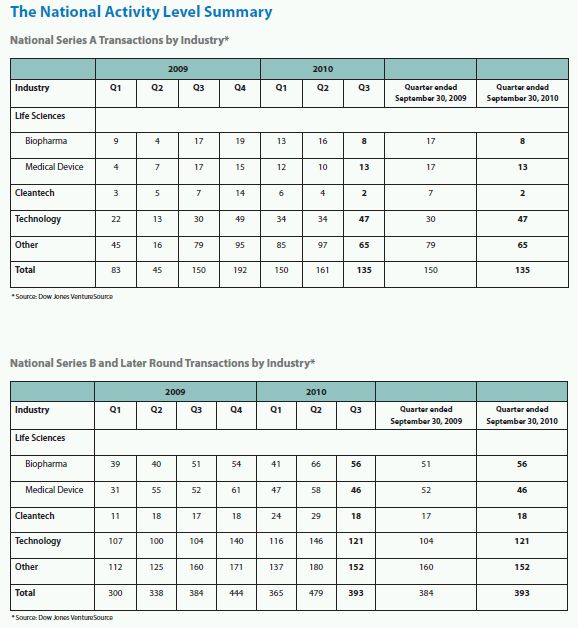
Activity Level Overall, the number of New England Series A transactions continued an upward trend during Q3 2010, with the total number of transactions up over both Q2 2010 and Q3 2009. There was, however, considerable variation in the number of deals across and within industry sectors between the different time periods. The technology sector showed the most life, with the activity level for Q3 2010 up over both Q2 2010 and Q3 2009 levels, significantly so in comparison to Q3 2009. Cleantech activity in Q3 2010 was relatively moribund, up modestly from Q2 2010 but essentially flat with Q3 2009. The life sciences and "other" sectors were the poorest performers, with activity levels in both sectors down in Q3 2010 from Q2 2010 and Q3 2009 levels.
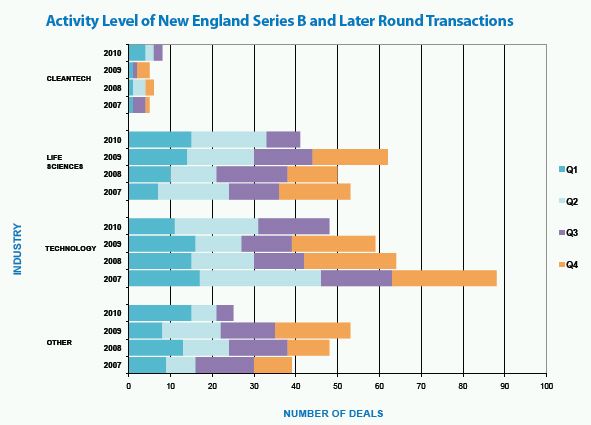
Overall, the number of New England Series B/Later Round transactions during Q3 2010 was down significantly compared to both Q2 2010 and Q3 2009. The technology sector fared best, and the drop-off in the life sciences sector was particularly steep.
Deal Size
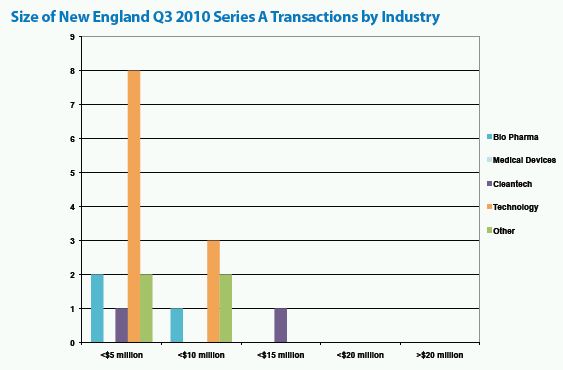
The bulk of the New England Series A transactions during Q3 2010 involved investments under $5 million. The concentration of transactions in this range was driven primarily by the large number of technology deals during the quarter. Only one New England Series A round transaction during Q3 2010 topped $10 million invested.
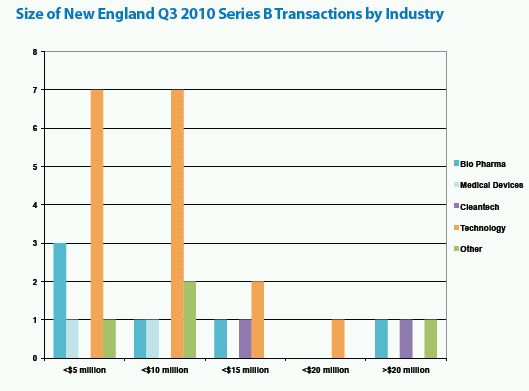
The deal size for New England Series B/Later Round transactions during Q3 2010 was not as concentrated as for Series A rounds. There were twelve transactions with invested amounts under $5 million, eleven with invested amounts between $5 million and $10 million, four with invested amounts between $10 million and $15 million, one with an invested amount between $15 million and $20 million, and three with invested amounts over $20 million. Fifty five percent of the under $5 million transactions were in the technology sector. Of the three transactions in the over $20 million category, one was in the bio pharma sector, one was in the cleantech sector and the other was in the "other" category.
Pre-Money and Post-Money Valuations
Series A Round. The reported Series A information presents the usual varied picture both across and within industry sectors:
Cleantech: There was one cleantech transaction, with an implied pre-money valuation of $19.0 million and an implied post-money valuation of $29.0 million.
Life Sciences: There was one life science transaction, with an implied pre-money valuation of $6.1 million and an implied post-money valuation of $11.3 million.
Technology: In the ten technology transactions, the implied pre-money valuations ranged from a low of $1.9 million to a high of $19.5 million. The implied post-money valuations ranged from a low of $2.7 million to a high of $28.1 million, with lowest and highest implied post-money valuations coming in the same transactions as the lowest and highest pre-money valuations.
Other: There was one transaction in the "other" category, with an implied pre-money valuation of $6.0 million and an implied post-money valuation of $14.6 million.
Series B/Later Round.
The reported Series B/Later Round information also presents a varied picture across and within industry sectors:
Cleantech: There was one cleantech transaction, a Series B even round with an implied pre-money valuation of $14.8 million and an implied post-money valuation of $29.7 million.
Life Sciences: There were six life science transactions, of which two were up rounds, two were even rounds, and two were down rounds. The implied pre-money valuations ranged from a low of $4.4 million to a high of $86.7 million, both in Series C down rounds. The implied post-money valuations ranged from a low of $8.3 million to a high of $89.7 million, in each case in the same transactions that showed the lowest and highest pre-money valuations.
Technology: There were thirteen technology transactions, of which nine were up rounds, two were even rounds, and two were down rounds. The implied pre-money valuations ranged from a low of $6.3 million in a Series B up round to a high of $63.4 million in a Series C-2 even round. The implied post-money valuations ranged from a low of $8.9 million to a high of $75.4 million.
Other: There were four transactions in the "other" category, of which two were up rounds and two were down rounds. The implied pre-money valuations ranged from a low of $18.0 million in a Series B down round to a high of $125.5 million in a Series B up round. The implied post-money valuations ranged from a low of $18.9 million to a high of $145.5 million, in each case in the same transactions that showed the lowest and highest pre-money valuations.
Terms
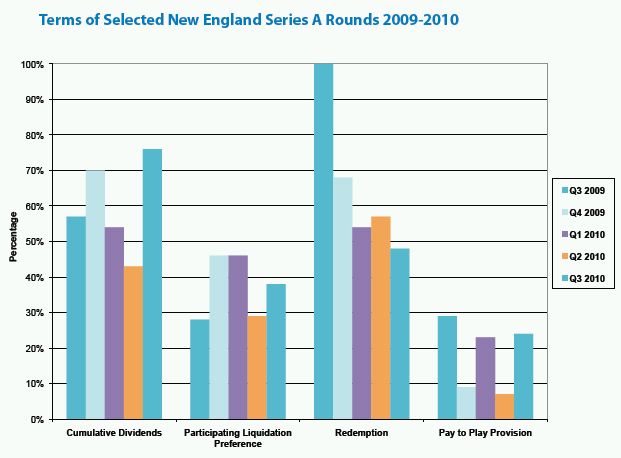
The bar graph of terms for selected New England Series A transactions shows the following trends in Q3 2010 as compared to the comparable prior year quarter and the immediately preceding quarter:
- an increase in the percentage of transactions with cumulative dividends (76% in Q3 2010 versus 57% in Q3 2009 and 43% in Q2 2010);
- an increase in the percentage of transactions with a participating liquidation preference (38% in Q3 2010 versus 28% in Q3 2009 and 29% in Q2 2010);
- a decrease in the percentage of transactions with a redemption provision (48% in Q3 2010 versus 100% in Q3 2009 and 57% in Q2 2010); and
- a decrease in the percentage of transactions with pay to play provision as compared to the comparable prior year quarter and an increase as compared to the immediately preceding quarter (24% in Q3 2010 versus 29% in Q3 2009 and 7% in Q2 2010).
The bar graph of terms for selected New England Series B/Later Round transactions shows the following trends in Q3 2010 as compared to comparable prior year quarter and the immediately preceding quarter:
- an increase in the percentage of transactions with cumulative dividends (76% in Q3 2010 versus 39% in Q3 2009 and 54% in Q2 2010);
- no change in the percentage of transactions with a participating liquidation preference as compared to the comparable prior year quarter and a decrease as compared to the immediately preceding quarter (64% in Q3 2010 versus 64% in Q3 2009 and 70% in Q2 2010);
- an increase in the percentage of transactions with a redemption provision (94% in Q3 2010 versus 78% in Q3 2009 and 65% in Q2 2010); and
- an increase in the percentage of transactions with a pay to play provision (43% in Q3 2010 versus 39% in Q3 2009 and 24% in Q2 2010).
Conclusion
The reported information suggests that the environment for venture investing continues to be sluggish. Nevertheless, there are positive signs. According to Thomson Reuters and the National Venture Capital Association, the significant improvement in exit activity for venture-backed companies in 2010 compared to 2009 continued in Q3 2010. They reported fourteen venture-backed IPOs in Q3 2010, down slightly from the Q2 2010 total but more than the total for all of 2009. They also reported 104 venture-backed M&A exits in Q3 2010, up slightly from Q2 2010 and up significantly from Q3 2009. The lion's share of the Q3 2010 exits were in the information technology sector, which accounted for over 50% of the IPOs and over 75% of the M&A transactions. Early stage investing also continued to show positive signs. The MoneyTree" Report by PricewaterhouseCoopers and the National Venture Capital Association for Q3 2010 indicates that nationally during the quarter early stage financings constituted 35% of overall deal volume and that first time financing remained relatively steady, with Q3 2010 marking the fourth consecutive quarter with more the $1 billion invested in first-time deals.
Unfortunately, there are negative indicators as well. According to Thomson Reuters and the National Venture Capital Association, venture-backed M&A exits with reported values showed less favorable returns in Q3 2010 than in Q2 2010. M&A exits with reported values greater than 4X the venture investment represented 33% of the Q3 2010 total versus 65% of the Q2 2010 total, and M&A exits with reported values less than 1X the venture investment represented 26% of the Q3 2010 total versus 15% of the Q2 2010 total. In addition, fundraising for venture capital firms continues to be discouraging. According to Thomson Reuters and the National Venture Capital Association, 45 funds raised a total of $3.0 billion of commitments during Q3 2010, of which $1.2 million was attributable to two funds.
For one looking for signs of hope, the trends in 2010 can be read as pointing toward a steadily improving environment for young, capital-efficient companies seeking early round financing. As fewer funds raise money and as fund sizes decrease, it would be reasonable to expect that these new smaller funds will have more time to devote to early stage companies and more inclination to do so. In addition, improving exit activity, so the argument goes, will free up bandwidth for existing funds with capital still to invest, allowing them to move beyond triage for their existing portfolio companies and back to making new investments in other companies. In the big picture, however, even if the worst of the storm has passed, the sky is still gray and the waters are still choppy.
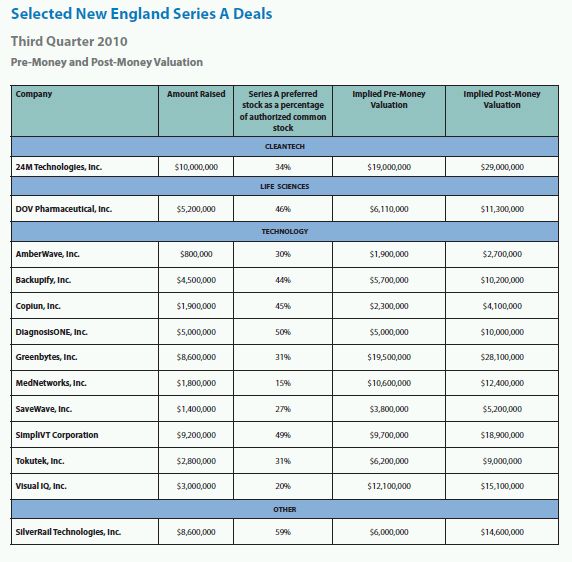
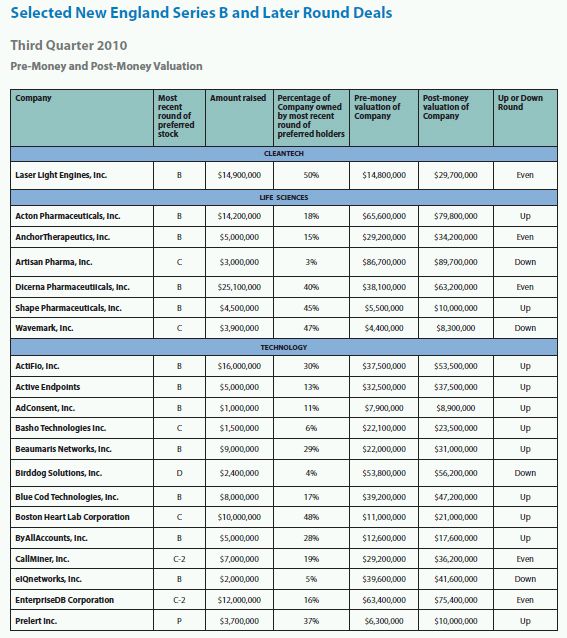
Figures shown in the Amount Raised, Pre-Money Valuation and Post-Money Valuation columns have been rounded to the nearest hundred thousand. This analysis is inherently imprecise and is based on a number of general assumptions which may or may not be accurate. However, in a typical situation we believe it will yield an approximation of the valuation placed on the company at the time of financing, and therefore may be of interest to our readers.
We can prepare a similar analysis across any group of transactions that our clients are interested in receiving. For example, we could prepare analysis for a group of competitive companies so you can see what the implied valuations of your competitors are. If you would like additional information on this service, please contact your lawyer at Foley Hoag or one of our Emerging Enterprise Center lawyers listed at the end of this publication.
The chart above summarizes publicly available information about various terms included in the Certificates for Incorporation for "Series A" financings for companies headquartered in New England. For the purposes of this table we have focused solely on transactions that appeared to us, from the public filings, to be identifiable as "Series A" financings. We have excluded transactions that appeared to us to involve considerations and concerns different from those applicable in a typical "Series A," such as might occur, for example, in the case of a recapitalization. For this reason, the set of transactions described above is somewhat different from the set of transactions described in the later tables. We have selected terms to report on that we believe will be of particular interest to entrepreneurs. Each of these terms is linked to a definition of that term on our website. Information included in the table above is based on information made publicly available by participants in the relevant transactions and therefore is not comprehensive.
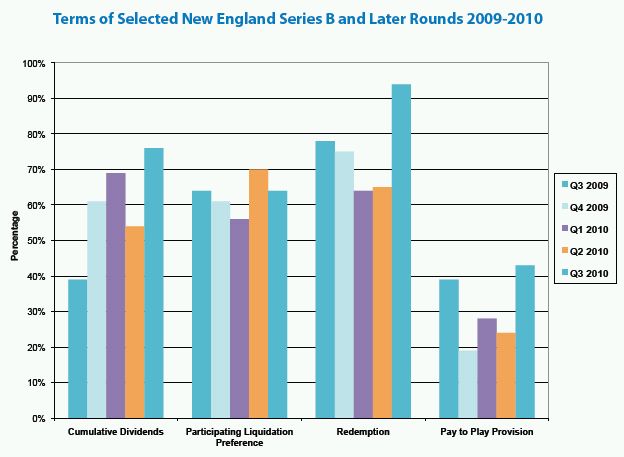
The chart above summarizes publicly available information about various terms included in the Certificates of Incorporation for "Series B" and later round financings for companies headquartered in New England. For the purposes of this table we have focused solely on transactions that appeared to us, from the public filings, to be identifiable as "Series B" and later round financings. We have excluded transactions that appeared to us to involve considerations and concerns different from those applicable in a typical "Series B" or later round, such as might occur, for example, in the case of a recapitalization. For this reason, the set of transactions described above is somewhat different from the set of transactions described in the later tables. We have selected terms to report on that we believe will be of particular interest to entrepreneurs. Each of these terms is linked to a definition of that term in our website. Information included in the table above is based on information made publicly available by participants in the relevant transactions and therefore is not comprehensive.
We can prepare a similar analysis across any group of transactions that our clients are interested in receiving. For example, we could prepare analysis for a group of competitive companies so you can see what the implied valuations of your competitors are. If you would like additional information on this service, please contact your lawyer at Foley Hoag or one of our Emerging Enterprise Center lawyers listed at the end of this publication.
The content of this article is intended to provide a general guide to the subject matter. Specialist advice should be sought about your specific circumstances.

