
OVERVIEW
Corporate governance practices vary significantly among public companies. This is a reflection of many factors, including:
- Differences in the stage of development of companies, including the relative importance placed on various values (for example, focus on growth and scaling operations may be given more importance);
- Differences in the investor base for different types of companies;
- Differences in expectations of board members and advisors to companies and their boards, which can vary by size, age of company, stage of development, geography, industry and other factors; and
- The reality that corporate governance practices that are appropriate for large, long-established public companies can be meaningfully different from those for newer, smaller companies.
Since the passage of the Sarbanes-Oxley Act of 2002, which signaled the initial wave of corporate governance reforms among public companies, Fenwick & West has surveyed the corporate governance practices of the companies included in the Standard & Poor's 100 Index (S&P 100) and the high technology and life science companies included in the Silicon Valley 150 Index (SV 150) each year.
In this report, we present statistical information for a subset of the data we have collected over the years, updating for the 2012 proxy season. These include size and number of meetings for boards and their primary committees, the number of insider directors, board leadership makeup, majority voting, board classification and use of a dual-class voting structure, as well as the frequency and number of stockholder proposals. In the 2012 edition, we have also published data covering the number of women on boards of directors, stock ownership guidelines for executive officers and directors and additional information about committees beyond the primary committees. In each case, we present comparative data for the S&P 100 companies and for the high technology and life science companies included in the SV 150, as well as trend information.
Governance practices and trends (or perceived trends) among the largest companies are generally presented as normative for all public companies. Fenwick & West collects information regarding public company governance practices to enable boards and companies in Silicon Valley to understand the actual corporate governance practices among their peers and neighbors, and understand how those practices contrast with practices among large companies nationally.
The 2012 constituent companies of the SV 150 range from Apple and Hewlett-Packard (HP) with revenue of approximately $128B and $125B, respectively to Meru Networks (Meru) and Intevac with revenue of approximately $90M and $85M, respectively, in each case for the four quarters ended on or about December 31, 2011. HP went public in 1957, Apple in 1980, Intevac in 1996 and Meru in 2010. Apple's and HP's peers clearly include companies in the S&P 100, of which they are also constituent members (seven companies were constituents of both indices for the survey in the 2012 proxy season), where market capitalization averages approximately $88B. Intevac's and Meru's peers are smaller technology companies that went public over the last half decade or so and have market capitalizations well under $1B. Compared to the S&P 100, SV 150 companies are generally much smaller and younger, have lower revenue and are concentrated in the high technology and life science industries. As the graphs on pages 3 through 6 illustrate, SV 150 companies also tend to have significantly greater ownership (whether equity ownership or voting power) by the board and management than S&P 100 companies.
While not specifically studied in this report, it is worth noting that the broad range of companies in the SV 150 (whether measured in terms of size, age or revenue) is associated with a corresponding range of governance practices. Comparison of governance practice statistics and trends for the top 501, middle 502 and bottom 503 companies of the SV 150 (in terms of revenue) bears this out.4 A few examples of such comparisons are included in this report. Additional comparison information of the top 50, middle 50 and bottom 50 companies of the SV 150 (as well as other data not presented in this report5 ) may be obtained by consulting your Fenwick & West Securities Partner.
Overview — Equity Ownership by Executives and Directors
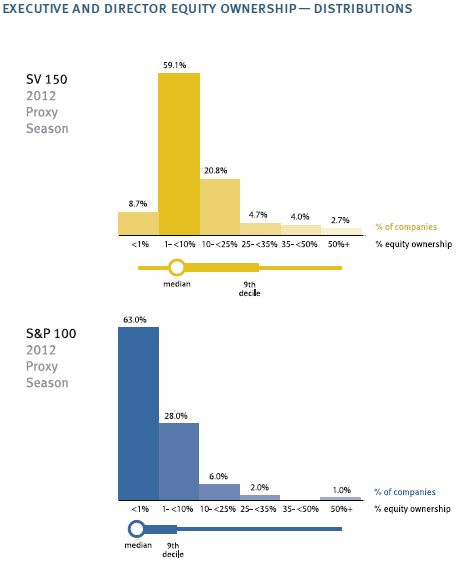
The graph below shows the distribution of the percentage of simple equity ownership of the directors and executive officers of the companies in each of the SV 150 and the S&P 100 for the 2012 proxy season.
The graphs below show the average percentages of simple equity ownership of the directors and executive officers of the companies in each of the SV 150 and the S&P 100 as a group from the 2004 through 2012 proxy seasons as well as the percentages of average equity ownership for the SV 150 broken down by the top 15, top 50, middle 50 and bottom 50 companies. As noted above, the distribution of simple equity ownership skews higher among SV 150 companies and that difference has held fairly steady over time.

Overview — Voting Power Ownership by Executives and Directors
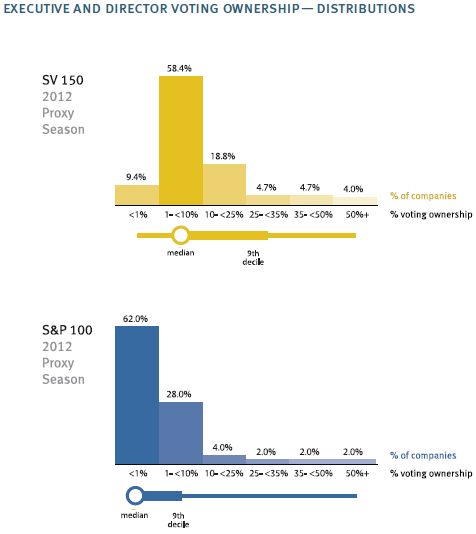
The graph below shows the distribution of the percentage ownership of total voting power of the directors and executive officers of the companies in each of the SV 150 and the S&P 100 for the 2012 proxy season.
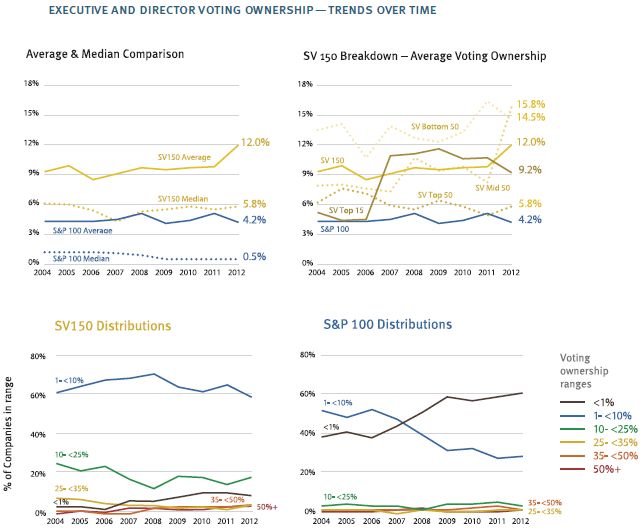
The graphs below show the average percentages of ownership of total voting power of the directors and executive officers of the companies in each of the SV 150 and the S&P 100 as a group from the 2004 through 2012 proxy seasons, as well as the percentages of average voting ownership for the SV 150 broken down by the top 15, top 50, middle 50, and bottom 50 companies. As noted above, the distribution of voting power ownership skews higher among SV 150 companies and that difference has held fairly steady over time.
BOARD SIZE AND MEETING FREQUENCY
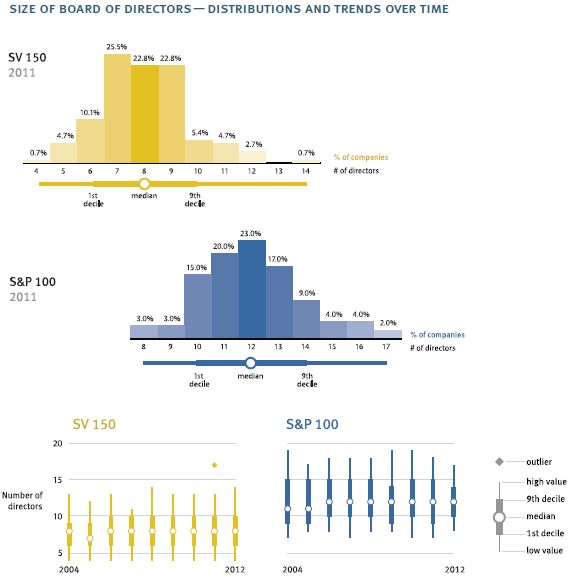
The number of directors tends to be substantially lower among the high technology and life science companies in the SV 150 (median = 8 directors) than among S&P 100 companies (median = 12 directors). Although they hold board meetings about as often, the SV 150 companies tend to skew slightly more toward more frequent meetings.
The following graphs show the distribution by number of directors among the two groups during the 2012 proxy season, as well as the trend over time (showing both the median number and the cutoffs for the deciles with the most and fewest directors).
The following graphs show the distribution by number of board meetings among the two groups as reported during the 2012 proxy season, as well as the trend over time (showing both the median number and the cutoffs for the deciles with the most and fewest meetings).

INSIDER DIRECTORS
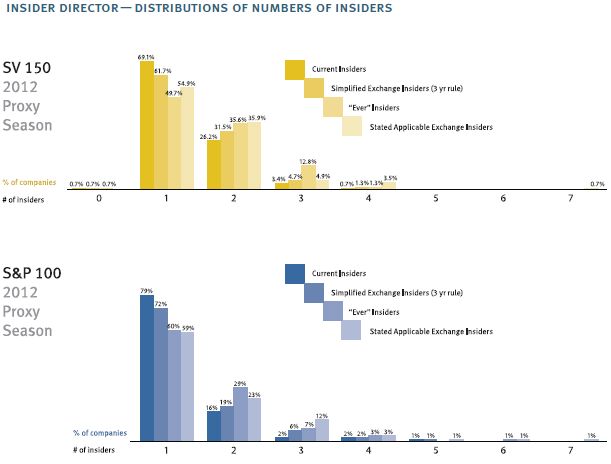
Insider directors are more common among members of the boards of the high technology and life science companies included in the SV 150 than among board members at S&P 100 companies. While generally their prevalence has declined over time in both groups, the SV 150 has not reached the level of the S&P 100 at the start of the period covered by the survey. This is largely a function of the relative size of the boards in the two groups rather than the absolute number of insider directors per board.
The following graphs show the distribution by number of insider directors among the two groups during the 2012 proxy season. In these graphs, we have shown "insider" status determined in various ways. See the discussion under "Insider / Independent" in the Methodology section at the end of this report for a description of the different methods of determining whether a director is an insider.
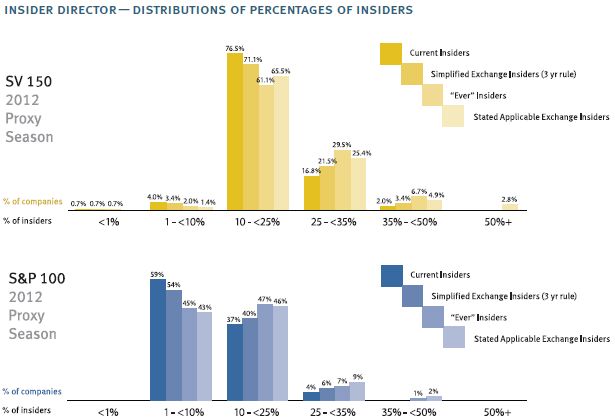
The following graphs show the trend over time of the average as a percentage of the full board that are insiders for each group. In these graphs, we have shown "insider" status determined in various ways. See the discussion under "Insider / Independent" in the Methodology section at the end of this report for a description of the different methods of determining whether a director is an insider.

To read this article in full, please click here.
Footnotes
1 This includes companies with revenue of approximately $1B or more.
2 This includes companies with revenue of at least approximately $260M but less than $1B.
3 This includes companies with revenue of at least approximately $83M but less than $260M.
4 Contrasting the top 15 or top 20 SV 150 companies (in terms of revenue – which means revenue of approximately $6B or more and approximately $4B or more, respectively), seven of which are included in the S&P 100, against the remaining SV 150 companies is similarly enlightening. There are also some differences between high technology and life science companies as groups within the SV 150.
5 Such as comparisons of the top 15 or top 20 SV 150 companies against the remaining SV 150 companies, comparisons of high technology and life science companies as separate groups within the SV 150, or other details related to the topics covered in this report.
The content of this article is intended to provide a general guide to the subject matter. Specialist advice should be sought about your specific circumstances.
