
Design patent examination has been subject to many recent changes at the USPTO, including changes in the application backlog and foreign filing. While design patents made up just under 8.0% of the patents issued in 2015, the trends in design patent examination are still instructive, especially when compared to utility patent examination.
Fun Fact No. 1. The backlog for most patent applications is decreasing; meanwhile, the design application backlog is increasing.
In May 2017, there were only 542,840 unexamined utility, plant, and reexam patent applications pending¾a 67,000 plus reduction from October 2014. (Remember that as patents are examined, more are filed, so this means that not only did the PTO keep up with the new filings, it also chipped away at the backlog.) (See Patents Dashboard). Unfortunately, for designs, the backlog has increased during this same time period from 38,094 unexamined design applications in October 2014 to 42,883 as of May 2017. There is hope for the future, as the technology center responsible for designs has been hiring and now boasts 187 patent examiners.
Fun Fact No. 2. After increasing for two years, the total pendency for design patent applications has begun to decrease.
In October 2014, the pendency period for design patent applications was 17 months. By August 2015, that number had increased to 20.2 months. Over the next 21 months, however, that number has steadily decreased to 19.1 months as of May 2017. In contrast, the pendency period for other types of patent application has enjoyed a much more steady decrease. In October 2014, the pendency period for all applications was 27.4 months, and as of May 2017, that number decreased to 24.8 months.
Curiously, although the backlog for design patent applications shows an increasing trend, this trend does not correlate to the total pendency. This discrepancy is likely explained by the number of each type of patent examiner during those years. In 2011, there were only 95 design patent examiners, but that number doubled to 187 examiners by 2016. The number of examiners in all other tech centers, on the other hand, only increased from 6,685 in 2011 to 8,160 at the end of Fiscal Year 2016. This suggests that the increase in examiners of all types should have compensated for the increase in backlog.
Fun Fact No. 3. Design application appeals are rare¾perhaps with good reason.
In Fiscal Year 2016, there were 48,707 design patent applications under examination, and only 245, or about 0.5%, were on appeal. On the other hand, in Fiscal Year 2016, of the 926,584 other types of applications under examination, 36,350, or about 3.9% were on appeal.
Why so few design appeals? One explanation could be the higher allowance rate for design applications than for utility patents (84% versus 52%). Another possible explanation is that the pendency of a design appeal is 19.1 months (from the time of docketing at the PTAB through decision, not including the time for the Examiner's Reply to the applicant's Appeal Brief). For many applicants, this combined period (original pendency plus appeal pendency) of likely four-plus years cannot be justified given the relatively short life of many product designs. A third explanation is that the cost to prepare and file an appeal may be considerably more than the cost to file the design application in the first place.
Fun Fact No. 4. For both design patents and utility patents, the electronics industry is king.
Of the top ten assignees for utility patents granted in 2015, all ten are in the electronics industry. For design patents, six are in the electronics industry. A handful of names appear in both lists, including Samsung Electronics, Google, LG Electronics, and Microsoft. The data suggest that this trend is likely to continue. Since 2001, the top ten utility patent assignees have all been in the electronics industry; for design patents, the same six electronics-industry assignees have been in the top ten.
Fun Fact No. 5. Filings by foreign applicants continue to play an increasing role in U.S. utility and design patent examination.
Over the past twenty years, the percent of all applications arising from foreign applicants has steadily increased for both U.S. utility and design patent applications. As the graph below suggests, however, there are striking differences between the trends between utility and design patent applications.
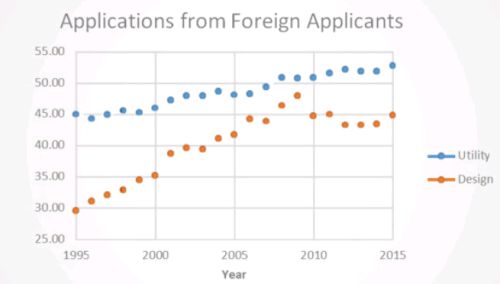
First, utility patent applications filed by foreign applicants have increased from 45% in 1995 to almost 53% in 2015. Meanwhile, design patent applications from foreign applicants have more drastically increased from 30% to over 45%. However, the level of design patent applications from foreign applicants appears to have leveled off over the past ten years.
Notably, after steady declines beginning in 2009, the increase in foreign design applications as a percentage of total applications began increasing in 2014, soon after the Patent Law Treaties Implementations Act of 2012 went into effect. Perhaps this increase is due to the PLT, but because the PLT is still fairly new, the exact effect on the level of these filings remains to be seen.
*Razi Safi is a Summer Associate at Finnegan.
The content of this article is intended to provide a general guide to the subject matter. Specialist advice should be sought about your specific circumstances.
