
On 21 October 2016 we delivered our predictions for the main Industrial Property figures for the end of 2016 in Spain and the figures filed before international bodies such as the OHIM and WIPO by Spaniards
In them, we published our statistical forecast, and, although it is wise to wait for the data to be "confirmed"1, what we can safely predict is that the data will not vary greatly compared to the projection we provided in October, specifically by -0.25%.
The first provisional official data published2, unfortunately indicate that the main milestones that we set out at the time will be confirmed, and some indicators will even worsen slightly. These include international, non-European-type indicators3 or those of applications under commercial names, the latter being especially worrisome since it tends to have a close relationship with national company-creation indicators. We hope it is only circumstantial.
As in the previous studies, a particularly troubling fact must be highlighted: never in the history of the "modern patent in Spain" have so few Spanish patents been applied for per capita. Last year we correctly predicted that the "baseline" of 3,0004 national patents applied for would be lost and this year the same prediction is reiterated. However, it seems that we may have finally bottomed out at around 2,800 patents...
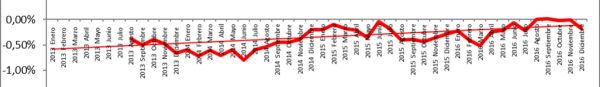
The moving average of monthly percentage changes of year-on-year applications applied for. As we can see it gets closer to 0, which shows the downward trend and lower levels.
... whilst waiting to see what the New Patent Law may bring, which we must remember will come into effect on 1 April 2017.
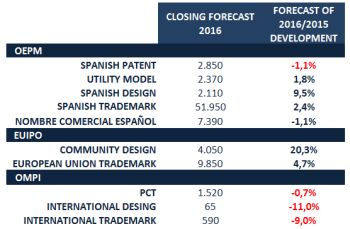
In this regard, if we link each type with the technological level of the nature of innovation carried out and the level of internationalisation of the specific figure chosen, as well as the evolution that we predict for 2016 with the general trend of the Spanish economy, we could draw the following table.

Types of technical innovation carried out and the level of internationalisation shown in the figure. Those in red we predict will have considerably worse development (negative rates) at the end of 2016 than the development of Spanish GDP. In orange are those that have done worse and in green are those that have done better.
In light of the diagram, we can say that Spain is innovative but we may be falling behind in more high-tech R&D.
Furthermore, the international, non-European indicators and the sudden fall in the aforementioned trade names in Spain are worrisome, due to their close relationship to other indicators, especially economic ones.
Therefore, we will specifically monitor the data that arise over the coming weeks and incorporate various analyses that we hope will be of interest.
Footnotes
[1] In the case of the SPTO, there is always a technical adjustment during the coming weeks. Considering the adjustment of other years, we have incorporated it in the following table.
[2] In the case of the SPTO: http://www.oepm.es/es/sobre_oepm/actividades_estadisticas/estadisticas/estadisticas/index.html
http://www.oepm.es/es/sobre_oepm/noticias/2017/2017_01_11_LaOEPMcierraAno8_5DI_1_88SDy0_94Invenciones.html
It is fair to say that the SPTO is one of the global industrial property offices that publishes the earliest and best statistical progress indicators on Industrial Property.
[3] However, it must be noted that it is precisely these that tend to be more unstable.
[4] It is a very symbolic number and Spain had not fallen below this level since 2001.
The content of this article is intended to provide a general guide to the subject matter. Specialist advice should be sought about your specific circumstances.
