
Financial market performance year-to-date has been extraordinary and dotted with idiosyncratic, systematic, and nearly systemic risk events. This short note discusses the returns of alternative risk premia ("ARP") funds and strategies during the period.
2020 Performance
Chart 1 illustrates the performance of a diversified portfolio of 28 ARP funds against key benchmarks in the first half of 2020. The portfolio has produced an excess return (over cash) of -9.8% with a volatility of 6.2%, lagging behind both traditional asset classes as well as liquid hedge funds as represented by HFRX Global (HFRXGL), Equity Market Neutral (HFRXEMN), and Systematic Diversified CTA (HFRXSDV) indices.
Chart 1: ARP Fund Portfolio and Benchmarks YTD to June 30th
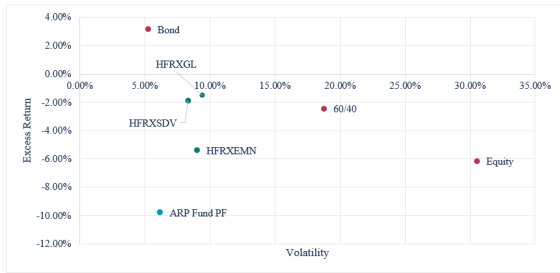
Source: MJ Hudson Allenbridge, Bloomberg. Returns are calculated as excess of cash from 31/12/2019 to 30/6/2020. The ARP Fund Portfolio is an inverse-volatility weighted combination of 28 ARP funds as calculated by MJ Hudson Allenbridge. The Equity benchmark is the MSCI World Index. The Bond benchmark is the Barclays Bloomberg Multiverse USD Hedged Index. The "60/40" benchmark is a portfolio invested 60% in the Equity and 40% in the Bond benchmark. HFRXGL, HFRXEMN and HFRXSDV are the HFRX Global, HFRX Equity Market Neutral, and HFRX Systematic Diversified CTA Index, respectively.
For comparison, in 2019 the same portfolio produced an excess return over cash of 1.96% with a volatility of 2.64%. Thus, this year has been characterised not just by a significant drawdown in ARP fund performance, but also a major increase in realised fund volatility.
Dispersion of ARP fund returns comes as no surprise to regular observers of the industry, and the first few months of 2020 have once again demonstrated the diversity of outcomes achieved by managers operating under the broad ARP label. Chart 2 displays the risk and excess returns of the 28 individual ARP funds constituting the portfolio in 2020. The average fund has returned -9.6%, and individual returns range from a low of -27.8% to a high of +6.6%. Just four funds have recorded a positive return year-to-date.
Chart 2: ARP Funds and Benchmarks (YTD to June 30th)
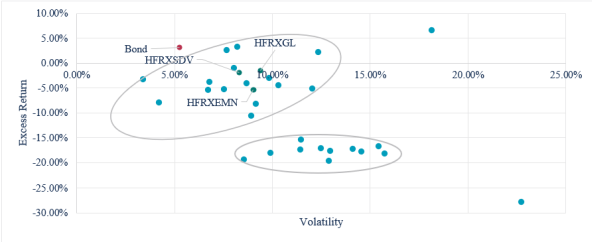
Source: MJ Hudson Allenbridge, Bloomberg. Returns are calculated as excess of cash from 31/12/2019 to 30/6/2020. The Bond benchmark is the Barclays Bloomberg Multiverse USD Hedged Index. HFRXGL, HFRXEMN and HFRXSDV are the HFRX Global, HFRX Equity Market Neutral, and HFRX Systematic Diversified CTA Index, respectively.
Chart 2 shows that, excluding the two outliers at the opposite ends of the performance spectrum, fund returns fall into two broad groups. The first one clusters around the liquid hedge funds benchmarks and has an average YTD excess return of -3.6%. Several of the managers in this group have either a macro / CTA background, or focus on a short list of core strategies with simple implementation. The second cluster produced an average YTD excess return of -17.7% and includes most of the funds that we would classify as "applied academic" in their approach. The weak performance of classic risk premia factors especially in the single stock equity space have made a significant negative contribution to many of the funds in the second group.
Industry Performance Attribution
How surprised should one be about the recent results? As discussed in our annual ARP Fund Review reports, we consider investment bank-sponsored alternative beta strategies as useful tools that help in understanding ARP fund performance. We report the year-to-date returns of the main investment bank strategy composites and a global equity market benchmark in Table 1 below. For context, we also include the YTD performance to March 24th, representing the week of the recent bottom in the equity market.
Table 1: ARP Strategy Composite Performance in 2020
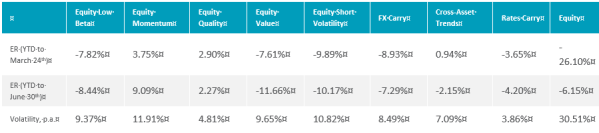
Source: MJ Hudson Allenbridge, Bloomberg, PremiaLab. Returns are calculated as excess of cash from 31/12/2019 to 30/6/2020. The ARP Strategy Composites are baskets of investable ARP strategy indices offered by investment banks, as calculated by MJ Hudson Allenbridge using data from PremiaLab. The Equity benchmark is the MSCI World Index.
Most of the strategies have produced negative returns in 2020, with the exception of Equity Momentum and Equity Quality. Furthermore, the performance of most composites has continued to slip in the weeks following the equity market bottom, whereas global equities have made back most of the losses year-to-date.
The debate on the viability of systematic value investing continues as lively as ever, but so far 2020 has not brought much joy to its proponents. Similarly, returns to most carry strategies, including Short Volatility have been unsurprisingly negative. The analysis in our 2020 ARP Fund Review suggests, however, that the industry has been overall less exposed and better prepared for the risks inherent in Short Volatility this year than during the February 2018 shock.
The negative returns of Equity Low Beta and Rates Carry strategies have been a deviation from historical patterns, as these strategies have typically behaved more defensively during equity market selloffs (see Chart 3 plotting the rolling 26-week correlation of these strategies against the MSCI World index). In 2020, the rapid fall in equity markets during March exposed the embedded leverage within Equity Low Beta strategies, as the realised betas of short and long portfolios converged during the market decline. Rates Carry strategies suffered from the large fall in US bond yields, which followed a period of flat or inverted US yield curve.
Chart 3: Rolling 26-week Correlation to Global Equities
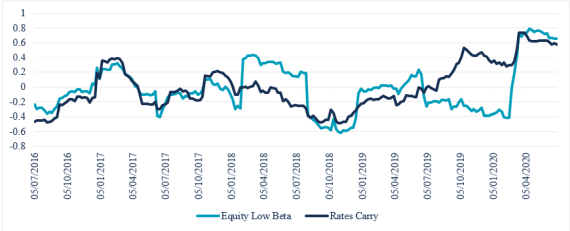
Source: MJ Hudson Allenbridge, Bloomberg, PremiaLab. The ARP Strategy Composites are baskets of investable ARP strategy indices offered by investment banks, as calculated by MJ Hudson Allenbridge using data from PremiaLab. The Equity benchmark is the MSCI World Index.
The Cross-asset Trend strategy performance reported in Table 1 reflects a similar pattern to the HFRX Systematic Diversified CTA index. The speed of the market moves this year, both to the downside and in the subsequent recovery, has been too fast for most mainstream trend following algorithms to capture. We note, however, that some short-term trend models, especially those using intra-day signals, offered diversification and substantial positive returns during the worst weeks of market turbulence.
Outside of these core strategies, Commodity Curve algorithms that were short near-term crude futures provided some welcome relief to ARP portfolios during the oil market selloff. Commodity strategies have provided relatively uncorrelated returns in past periods, but their adoption in ARP funds is not universal, due in part to the implementation challenges posed by UCITS regulations.
Finally, our 2020 ARP Fund Review reported a small number of funds allocating into "alternative risk transfer" strategies that aim to monetize market imbalances in derivatives such as implied dividends and correlation. Relatively less scalable and less liquid by nature, these strategies suffered significant mark-to-market losses during this year's market turmoil.
In the 2020 ARP Fund Review we presented simple regression models that explained the majority of ARP fund performance in 2019 by reference to a handful of core strategy composites (Equity Low Beta, Quality, and Value, FX and Rates Carry, and Cross-Asset Trend Following) and the equity benchmark. Chart 4 illustrates the results of an experiment of forecasting the year-to-date performance of the ARP industry based on the loadings from the regressions using 2019 data. In other words, if the strategy exposures were correctly identified and have remained broadly constant, we should be able to explain some of the 2020 performance by the factor model.
Chart 4: ARP Fund Portfolio ytd to june 30th: actual vs. forecast
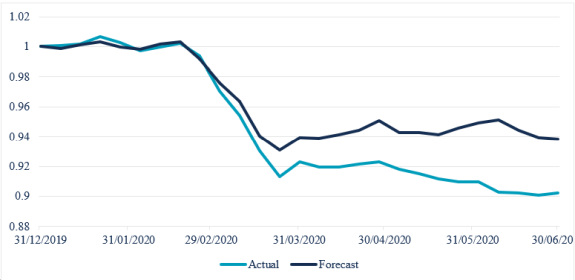
Source: MJ Hudson Allenbridge, Bloomberg, PremiaLab. The ARP Fund Portfolio is an inverse-volatility weighted combination of 28 ARP funds as calculated by MJ Hudson Allenbridge. The regression model used to forecast the 2020 returns is model (4) in Table 10 of the MJ Hudson Allenbridge Alternative Risk Premia Fund Review 2020. Models (2), (3), and (5) produce broadly similar results.
The model produces a broadly satisfactory forecast of the actual portfolio performance, with an r-squared of 0.77 (i.e. 77% of the actual performance this year can be explained by the funds' exposures estimated from 2019 data, and this year's realized performance of the composites and the equity benchmark). The tracking is very close until mid-March, and thereafter as the equity market recovers most of its losses the actual fund portfolio continues to drift lower, resulting in a -3.6% difference in year-to-date performance. Although we would not expect a factor model ever to precisely match future realised returns, we do suggest that at least some part of the performance deviation is a result of de-risking by fund managers following the extremely volatile and illiquid market conditions during March. In our 2020 ARP Fund Review we estimated an equity market beta of 0.11 for the ARP fund industry based on 2019 data. Hypothetically, if the funds in aggregate adjusted their equity exposure to zero in late March, this would by itself explain most of the difference between actual and forecast performance.
Conclusion
Our conclusion is that the ARP fund industry performance in 2020 has been broadly in line with expectations based on historical performance patterns – that is, given the performance of the underlying strategies and that of broader asset markets. Recent data and comments by fund managers further suggest that the speed and size of recent market moves took most of the investment community by surprise. ARP funds were overall no exception, and some of the recent underperformance can be attributed to managers' ill-timed de-/re-risking decisions.
At a more fundamental level, most of the common ARP factors and styles struggled during the recent market turmoil and the few positive performers were not enough to turn around the results for most diversified strategy portfolios. While the strategies offer some diversification to traditional assets, this year has once again demonstrated that at times of market stress such benefits may be limited. We may be stating the obvious, but ultimately most ARP strategies derive their returns from explicit exposure to risks such as market shocks and tail events (carry strategies, short volatility) or complexity and illiquidity (some commodity and ART strategies). In other cases, the risk manifests itself in lengthy periods of underperformance (e.g. value and trend strategies). Finally, some strategies seek nothing but the targeted extraction of "traditional" premia (e.g. term premia in fixed income). As to the ongoing viability of ARP as an investment style following recent performance, we would be hesitant to conclude that these risks are no longer compensated in the future. On the contrary, the opportunity set in the market is likely to be more attractive following a crisis than at times when assets are priced for perfection and all premia are compressed. The evidence from the past few years does suggest, however, that successful ARP strategy implementation and return extraction is not a trivial exercise in practice.
From the perspective of institutional asset allocation, we argue that ARP funds remain an investment choice that should be evaluated against its representative peer group, namely other liquid alternatives as well as the universe of individual ARP strategies offered by investment banks. Understanding performance attribution and whether a fund is charging fees for access to commoditised strategies or genuinely differentiated investment and implementation skill remains a crucial consideration for asset owners as beneath the disappointing broad industry performance in recent years, success in manager selection has been a major determinant of actual investor outcomes.
The content of this article is intended to provide a general guide to the subject matter. Specialist advice should be sought about your specific circumstances.
