
Business Insolvencies in 2023: A Comparative Overview
The year 2023 saw a total of 4,810 businesses file for insolvency in Canada, which marked the largest annual volume since we began tracking insolvency data in 2019. This total annual volume is a 41.4% increase since the previous year. It is also a 30.7% increase compared with the second-highest annual volume tracked, which was the total number of business insolvencies in 2019. It appears that businesses continue to struggle with managing higher input costs as well as costs to service or refinance accumulated debts through 2023.
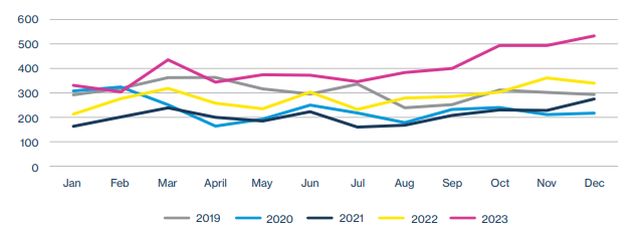
As shown in Figure 1, total business insolvencies rose 34.7% over Q3 2023 levels, from a total of 1,129 filings to 1,521 filings. Specifically, recently released data from the Office of the Superintendent of Bankruptcy indicate that business insolvencies rapidly picked up in Q4 2023. Compared with the Q4 data from previous years, total business insolvencies rose 67.7% from 2019 levels, 127.7% from 2020 levels, 107.5% from 2021 levels and 51.6% from 2022 levels.
Figure 1: Total Business Insolvencies in Canada
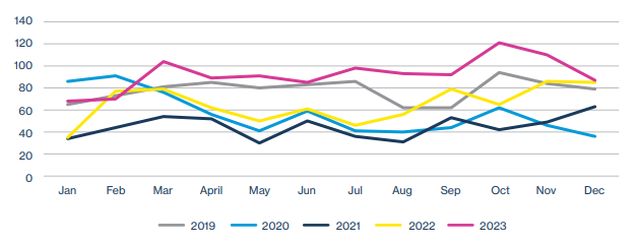
Over 2023, a total of 1,108 business proposals and 3,702 business bankruptcies were recorded. This meant that, overall, business proposals made up about 23% of all filings, and business bankruptcies made up the remaining 77%. The proportion of business proposals notably decreased in November and December 2023. From January to September 2023, on average, business proposals made up 24.1% of total insolvencies. However, this proportion decreased to 22.2% in November and reached a low of 16.3% in December. As shown in Figures 2 and 3, a decrease of business proposals corresponds to a hike in business bankruptcies, which could indicate fewer viable refinancing options available to businesses.
Figure 2: Business Bankruptcies in Canada
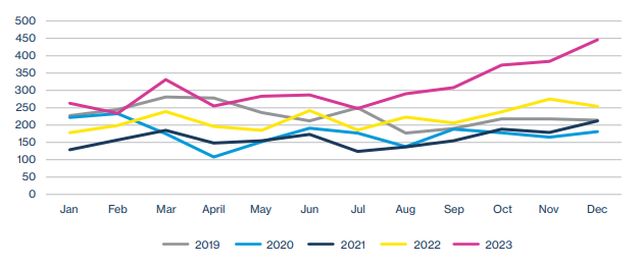
Figure 3: Business Proposals in Canada
From a geographical perspective, almost all of the Q4 2023 spike results from an increase in business insolvencies in Québec and Ontario. As mentioned above, the total number of business insolvencies grew by 392 filings between Q3 and Q4 2023; 99% of this growth—that is, 388 out of 392 filings—can be accounted for by filing increases in Québec and Ontario. From Q1 to Q3 2023, the total number of business insolvencies averaged 642 per quarter in Québec and 282 per quarter in Ontario. In Q4, business insolvencies rose significantly to 886 incidences in Québec and 435 filings in Ontario.
A notable observation that may persist into 2024 is the increase in business insolvency filings in Saskatchewan. The monthly average of filings from Saskatchewan has been 4.5 filings per month from Q1 to Q3 of 2023. In Q4 2023, however, the monthly average of filings hiked to 6.7 filings, indicating a spike of almost 50%.
Figure 4: Total Insolvencies in Most Affected Sectors, 2019-2023
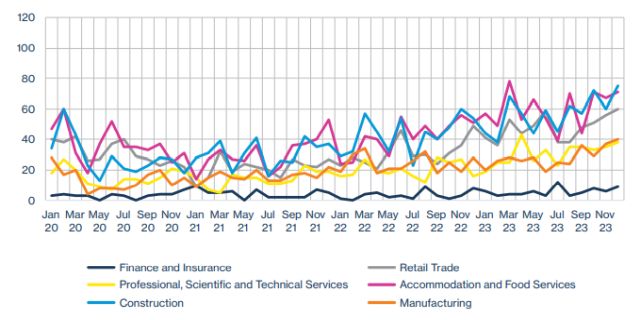
When analyzed by sector, construction, manufacturing, retail trade, finance and insurance, professional, scientific and technical services and accommodation and food services all saw significant increases in business insolvencies from 2022 to 2023. In total, these sectors had reported 1,942 insolvencies in 2022, which grew to 2,762 reported insolvencies in 2023, a growth of 42.2%.
As shown in Figure 4, of these notable sectors, construction and accommodation and food services continue to experience the highest volume of insolvencies. Over 2023, the construction sector had 681 business proposals and bankruptcies, a rise of 19.1% from 519 proposals and bankruptcies in 2022. For accommodation and food services, the increase was 43.8%, from 500 business proposals and bankruptcies in 2022 to 719 in 2023.
The retail trade sector experienced a relatively lower volume of insolvencies than the construction and accommodation and food services sectors. Insolvencies in retail trade continued to be volatile in 2023, averaging 47.8 filings per month with a low of 36 filings in February and the highest volume of 60 filings in December. Compared with the 2022 data for the retail trade sector, there was an increase in business insolvencies in 2023. The average monthly filing volume was 31.2 in 2022—that is, 34.7% lower than 2023 levels.
Since our previous discussion of the professional, scientific and technical services sector in Issue 9, business insolvencies in this sector have continued to grow. After its peak of 43 filings in April 2023, monthly filings averaged 32.3 filings for the rest of the year and ended 2023 with 38 filings in December 2023. By comparison, average monthly filings for this sector was 20.2 filings in 2022 and only 14.2 filings in 2021. It remains to be seen whether business conditions for the professional, scientific and technical services sector will stabilize or continue to worsen in 2024.
To view the full article, click here.
The content of this article is intended to provide a general guide to the subject matter. Specialist advice should be sought about your specific circumstances.