
Introduction
Insurance policy underwriters and litigators in securities class actions place importance on the total amount of coverage, but also focus on where their coverage stands in the insurance tower.
NERA tracks settlements in securities class actions filed in US federal and state courts. For each case, NERA collects dozens of case characteristics. We apply statistical techniques to assess the effect of case-specific factors on the settlement amount. In the event of a securities class action, the predicted settlement can be used for understanding aggregate exposure, planning strategy, and conducting mediation discussions.
Predicted settlement analysis estimates the total expected payout in the event of a settlement. However, each insurer's placement in the tower of coverage is crucial to understanding what the predicted settlement means for them. If the insured faces securities litigation, a given expected settlement can imply either a near-certain full payout on a policy underwritten by an insurer or a probability of any payout close to zero.
This paper discusses a new tool called Coverage Tower Analysis. It is based on NERA's predicted settlement model and quantifies the underwriter's expected payout and incentives driven by the probabilities that a settlement will fall in a specific tier of the insurance tower.
The insurer's position in the coverage tower is crucial to interpreting expected settlement numbers.
NERA's Predicted Settlement Model
NERA has examined historical settlements in over 1,000 securities class actions and identified key drivers of the settlement amount. Among the potential factors involved are:
- investor losses (a proxy for the size of the case);
- the market capitalization of the issuer;
- types of securities alleged to have been affected by the fraud;
- variables that serve as a proxy for the "merit" of plaintiffs' allegations (such as whether the company has already been sanctioned by a governmental or regulatory agency or paid a fine in connection with the allegations);
- admitted accounting irregularities or restated financial statements;
- the existence of a parallel derivative litigation; and
- evidence of experienced plaintiffs, such as institutional investors or a public pension plan.
Together, these characteristics explain most of the variation in settlement amounts.
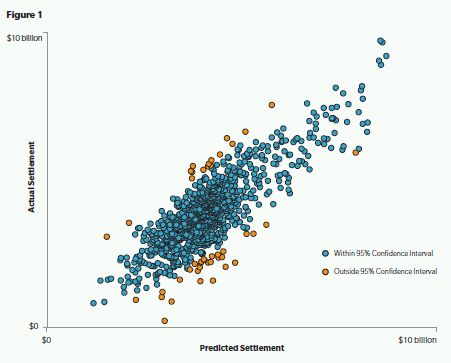
Alongside the estimate of expected settlement, the model can also be used to derive a range known as the "confidence interval" for the estimate. The following graph illustrates the precision of NERA's predicted settlement and confidence bounds ranges. The blue dots represent cases where the actual settlement was within the estimated 95% confidence interval. The orange dots are those cases that settled outside the estimated 95% confidence range. On average, only 5% of all cases settle outside the high and low values for the range.
Estimating Litigation Exposure
The vast majority of S&P 500 companies have insurance that covers payouts for the purposes of defending and settling a securities class action, and the latest data show that more than a third of all companies with such policies increased their D&O liability insurance limits in 2011.1 The individual insurance policies that the company carries form what is known as the tower. For the insurer of a defendant in a securities class action, its own position in the defendant's insurance coverage tower is crucial to interpreting any expected settlement number, as seen in the following example.
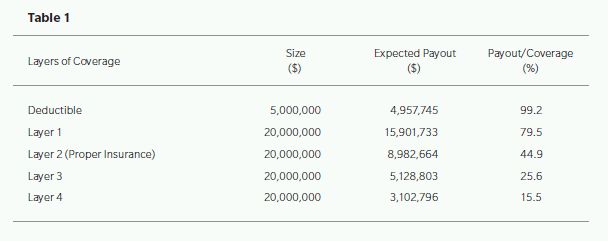
Small Tech ("ST"), a hypothetical company currently facing a securities class action, has a tower with a $5 million deductible and four subsequent layers of coverage of $20 million each.
NERA was retained by Proper Insurance ("PI"), the hypothetical carrier for the second layer, to perform a predicted settlement analysis. PI had underwritten a policy that would pay out the next $20 million in litigation costs above the $5 million deductible and the $20 million of coverage in the layer below (i.e., $20 million in excess of an attachment point of $25 million).
NERA calculated that the expected settlement for ST's litigation was $45 million, equal to a full payout by PI. However, the median predicted settlement for ST was $30.8 million, meaning that half of all settlements in similar circumstances would fall below that amount. NERA also calculated that the predicted settlement would fall within a 95% confidence interval between $5.6 million and $169 million. ST would become another blue dot on Figure 1 if it settled within these ranges, which occurs with a frequency of 19 in every 20 cases.
An expected settlement at or above the full amount of coverage does not imply an expected payout equal to the full amount of coverage.
Coverage Tower Analysis: Probabilities
Coverage tower analysis can be used to interpret what the expected settlement means relative to any degree of coverage in the tower.
In our simple example, PI underwrote the second $20 million layer above the $5 million deductible. Coverage tower analysis shows PI would face a 60% chance of paying some amount towards the claim and a 33% probability of paying the full amount under the policy. See Figure 2 below.

Similarly, the insurer underwriting the first layer will pay some amount toward the settlement with a 98% probability, while the insurer underwriting the top-most layer in ST's tower has a probability of 20% of paying a non-zero amount, and only a 12% probability of paying the full amount of their $20 million policy.
Coverage Tower Analysis: Expected Payout
The mean predicted settlement of $45 million does not imply a full payout by PI. The probability of a full $20 million payout is only one-third.
While NERA's predicted settlement analysis calculates the expected settlement amount, Coverage tower analysis calculates the expected payout for any underwriter in the tower. For the first $20 million layer over the retainer, the expected payout is $15.9 million, 80% of the full coverage amount. For PI, on the other hand, the expected payout is $9 million, 45% of the full coverage amount. In other words, an expected settlement at or above the full amount of coverage does not imply an expected payout equal to the full amount of coverage.
Uses of Coverage Tower Analysis
Various underwriters in ST's coverage tower have different expected payouts and they will face different and quantifiable exposure. Since the exposure is determined by the predicted settlement and its distribution, the exposure would change when factors affecting the predicted settlement change. For example, one factor affecting the predicted settlement is the presence of a public pension plan as a plaintiff in the litigation. The defendants may be contemplating arguments and analyses to support the dismissal of that plaintiff. Coverage tower analysis can calculate the effect of this plaintiff's dismissal on the expected payout of each layer in the insurance tower.2
Coverage tower analysis results might also be useful in mediation. The sensitivity of individual insurers toward various assumptions affecting the possible payout can help the parties determine who will be the most involved participants in settlement considerations. Actions that raise or lower the expected settlement amount will also affect the Payout-to-Coverage ratio differently for the different layers. Underwriters in tiers close to the expected settlement amount will be more affected at the margin.
From the point of view of an insurer who has underwritten a policy and now faces a possible claim, the information may be useful in estimating the chance of a settlement reaching its own or other levels in the tower, or have implications for reserving. Coverage tower analysis can also be a valuable tool to review the policy's pricing and as an input in determining pricing for similar policies in the future.
Footnotes
1. Marsh, "Benchmarking Trends—D&O Limit Levels Increased in 2011," October 2011.
2. Note that the analysis is only appropriate when such actions are taken for the purposes of the litigation itself and not as a means of trying to affect the predicted settlement model. For example, the presence of an institutional lead plaintiff may be a signal about the merits of the case, and dismissing the institutional lead plaintiff solely to game the predicted settlement model will likely not affect the underlying dynamics of the litigation.
The content of this article is intended to provide a general guide to the subject matter. Specialist advice should be sought about your specific circumstances.

